What's in your dashboard by default
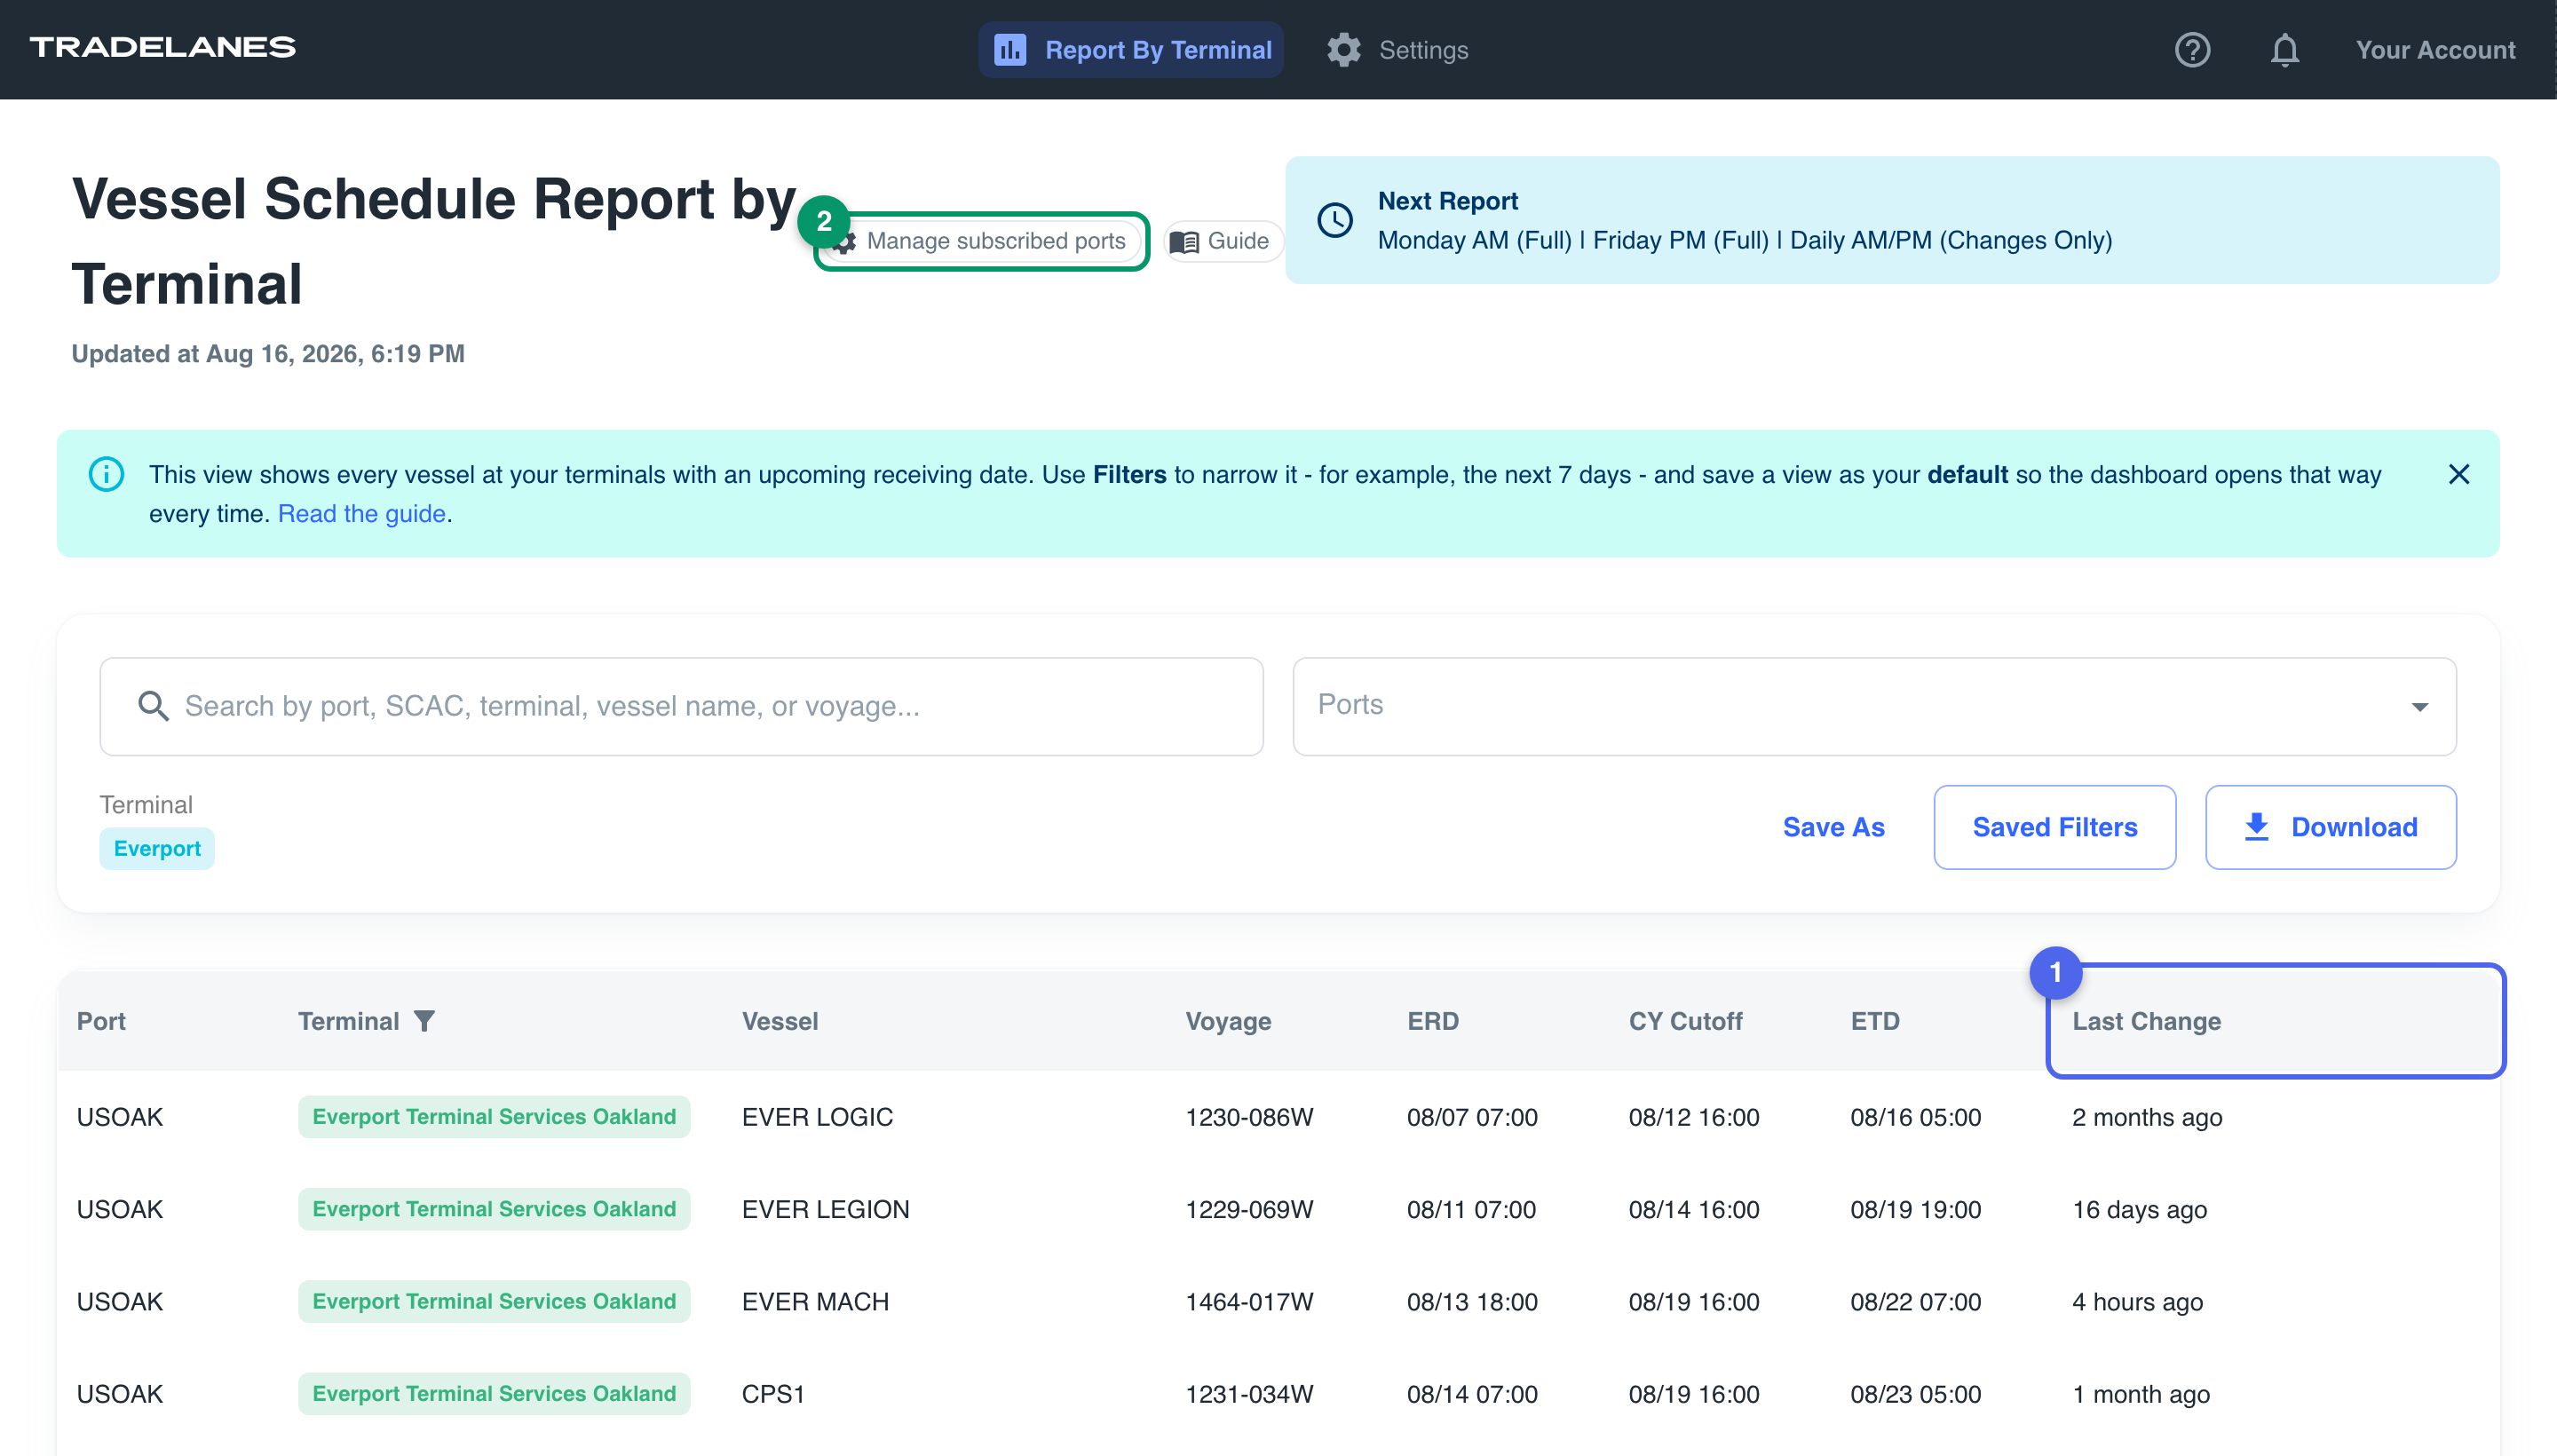
When you open the dashboard, you see every vessel at the terminals you track that has an upcoming receiving date - so the list is your near-term workload, not the entire schedule. A vessel appears when any of its key dates falls in a rolling window from a few days ago through the next two weeks:
- ERD (earliest receiving date)
- CY Cutoff
- ETD (estimated departure)
- Doc Cut
Each row shows: Vessel, Terminal, ERD, CY Cutoff, ETD, Voyage, Last Change, Port. Vessels are grouped by port and ordered by ETD, soonest first. Last Change tells you when that vessel's schedule was most recently updated - your fastest scan for what moved.
Nothing is hidden: every terminal you subscribe to is included. If that is a lot of vessels, the filters below let you focus.
Using filters
Filter the table to the vessels you care about right now. You can filter by:
- Text: Port, Terminal, Vessel, Voyage
- Date: ERD, ETD, CY Cutoff, Last Change
Open the filter controls from the table toolbar, choose a column, pick a condition, and enter a value. Filters combine, so you can stack them - for example, Terminal = Oakland and CY Cutoff is before [date] to see only what closes soon at one terminal. A common first filter is ETD within the next 7 days to trim the view to the immediate week.
Saving a filter
Once you have a filter set you like, save it so you do not have to rebuild it each visit. Saved filters live with your account, so any filter you save is one click to re-apply later. Give each one a clear name (for example, "Oakland - closing this week").
Setting a default filter
Mark one saved filter as your default and the dashboard opens with it already applied every time. This is the single most useful setup step: pick the view you look at most (often a near-term, one-or-two-terminal view) and make it your default so the dashboard lands on your real workload instead of the full list.
You can change or clear the default at any time; clearing it returns you to the full default view described above.
Adding team members
Two ways to get your colleagues in:
- Same-company sign-up (automatic). Anyone who signs up with an email on your company's domain is added to your company's account automatically - no invite needed. Just have them sign up at the same place you did.
- Invite from Settings. Go to Settings -> Team, add a teammate by email, and they join your account directly.
Everyone on the account shares the same company workspace; each person can keep their own saved filters and default view.
Quick-start checklist
- Confirm the terminals you track are the ones you want (add or remove in settings).
- Build a near-term filter (for example, ETD in the next 7 days).
- Save it and set it as your default.
- Invite the teammates who work these terminals with you.
That's it - your dashboard now opens on exactly the vessels you act on, and your team is working from the same view.
