When Monitoring Isn’t Measurement
Intro - The Illusion of Control
Walk into almost any export operations office and ask:
“How do you monitor vessel schedules?”
You’ll hear something responsible:
- We check carrier portals daily.
- We track ERD and CY Cut in a spreadsheet.
- We review changes every morning.
- We notify drayage when something moves.
On paper, this sounds disciplined.
In practice, it fails.
Not because teams are careless.
Because the environment changed - and the monitoring architecture didn’t.
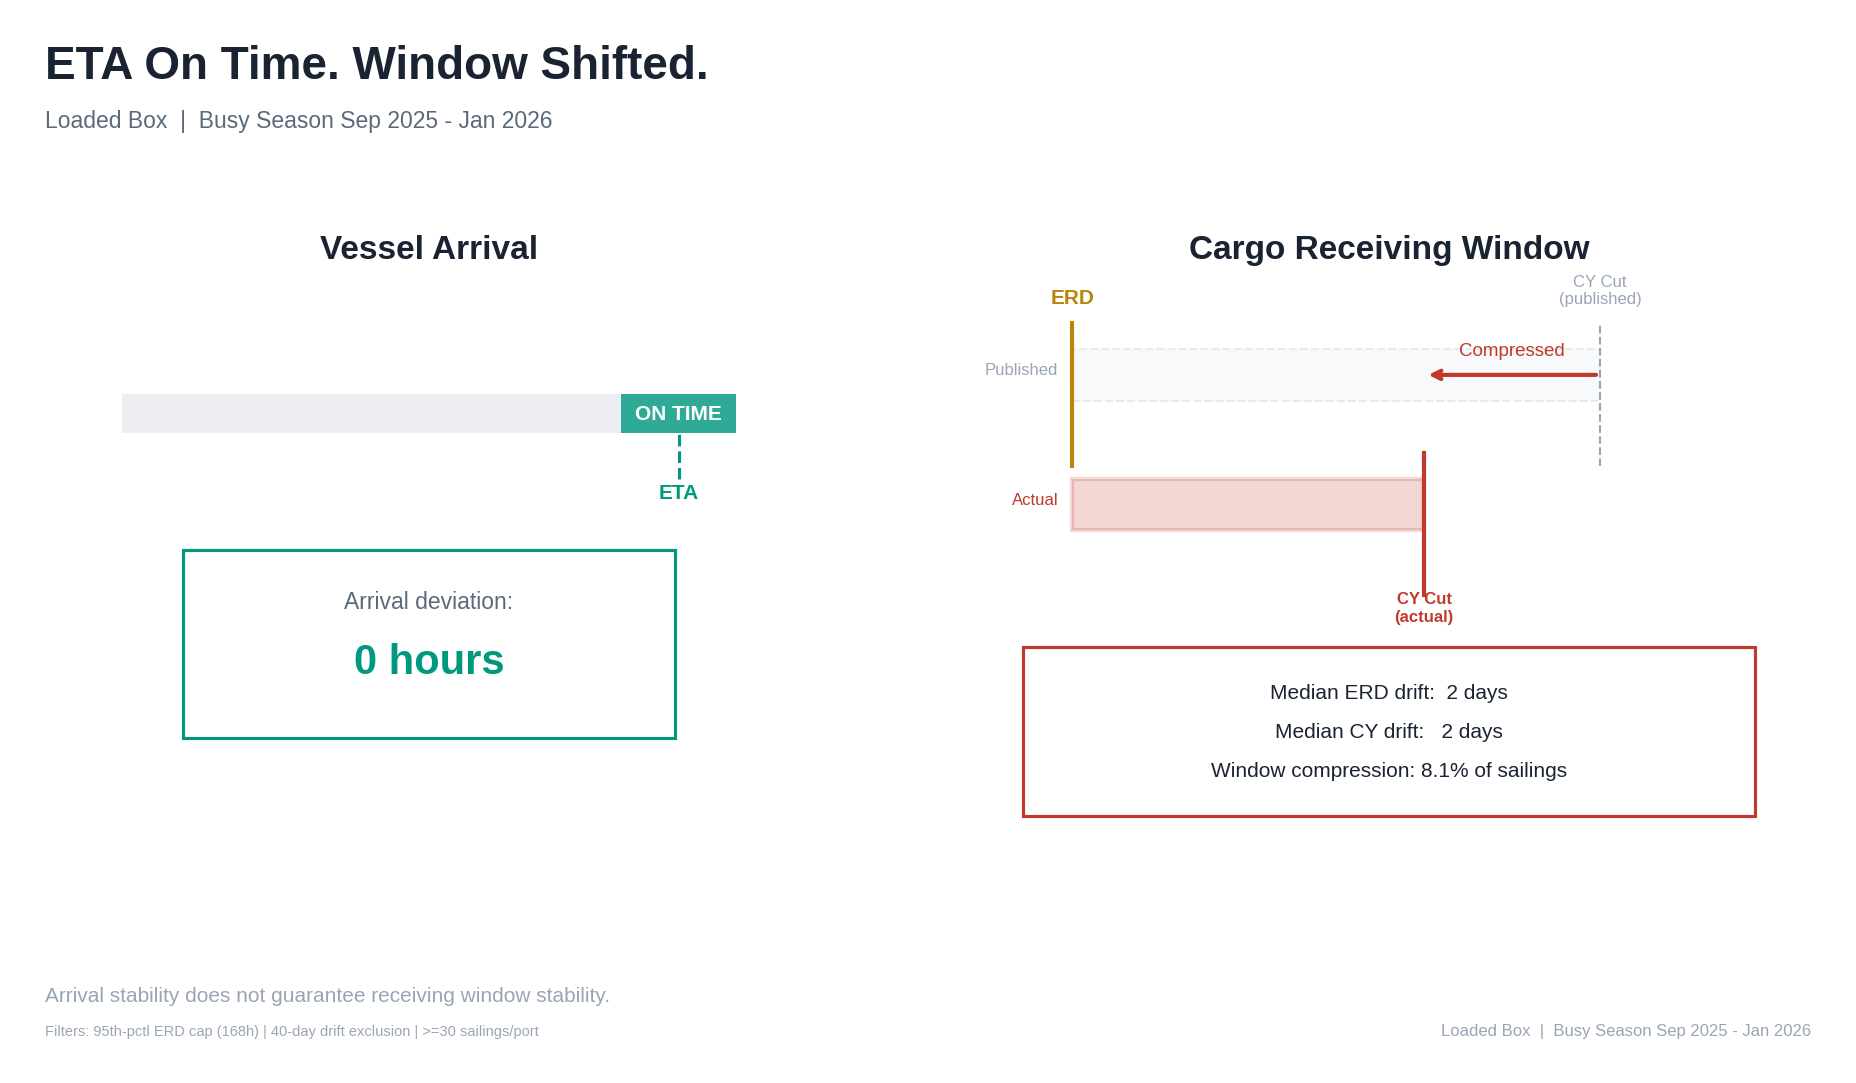
Figure 1 - ETA On Time. Window Shifted.
The Old Operating Assumption
For years, the model was simple:
Schedules change occasionally.
When they do, we react.
This worked when:
- Vessel reliability was relatively stable.
- Window changes were infrequent.
- Drift was small and early.
- Commitment timing was predictable.
Monitoring meant checking for visible movement.
The system was linear.
The workload was manageable.
The volatility was episodic.
That environment no longer exists.
Figure 2 - Episodic Change Model vs Continuous Drift
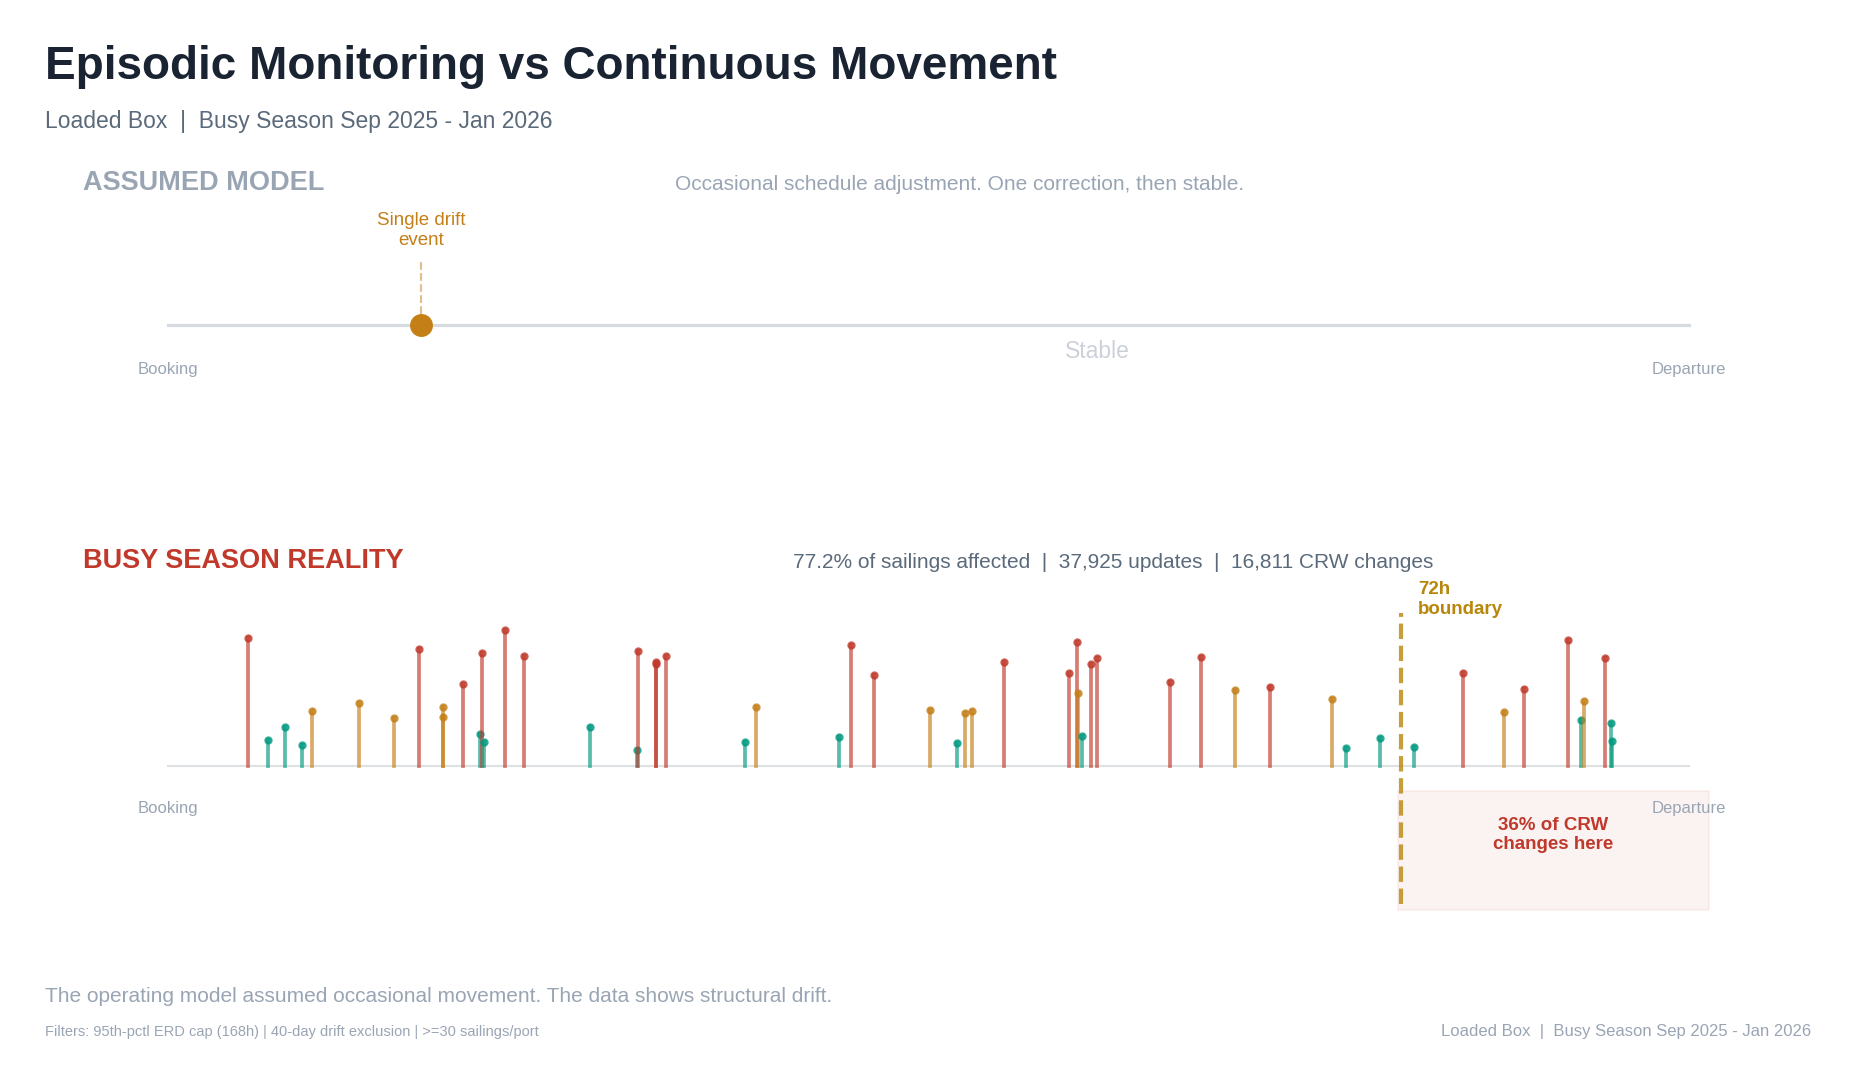
What the Data Actually Shows
Across 3,000+ monitored sailings:
- 78% experienced at least one receiving window change.
- Average changes per sailing: 12.2.
- Late-stage concentration varies by 6× across ports.
This is not episodic volatility.
It is structural movement.
Figure 3 - Signal Funnel
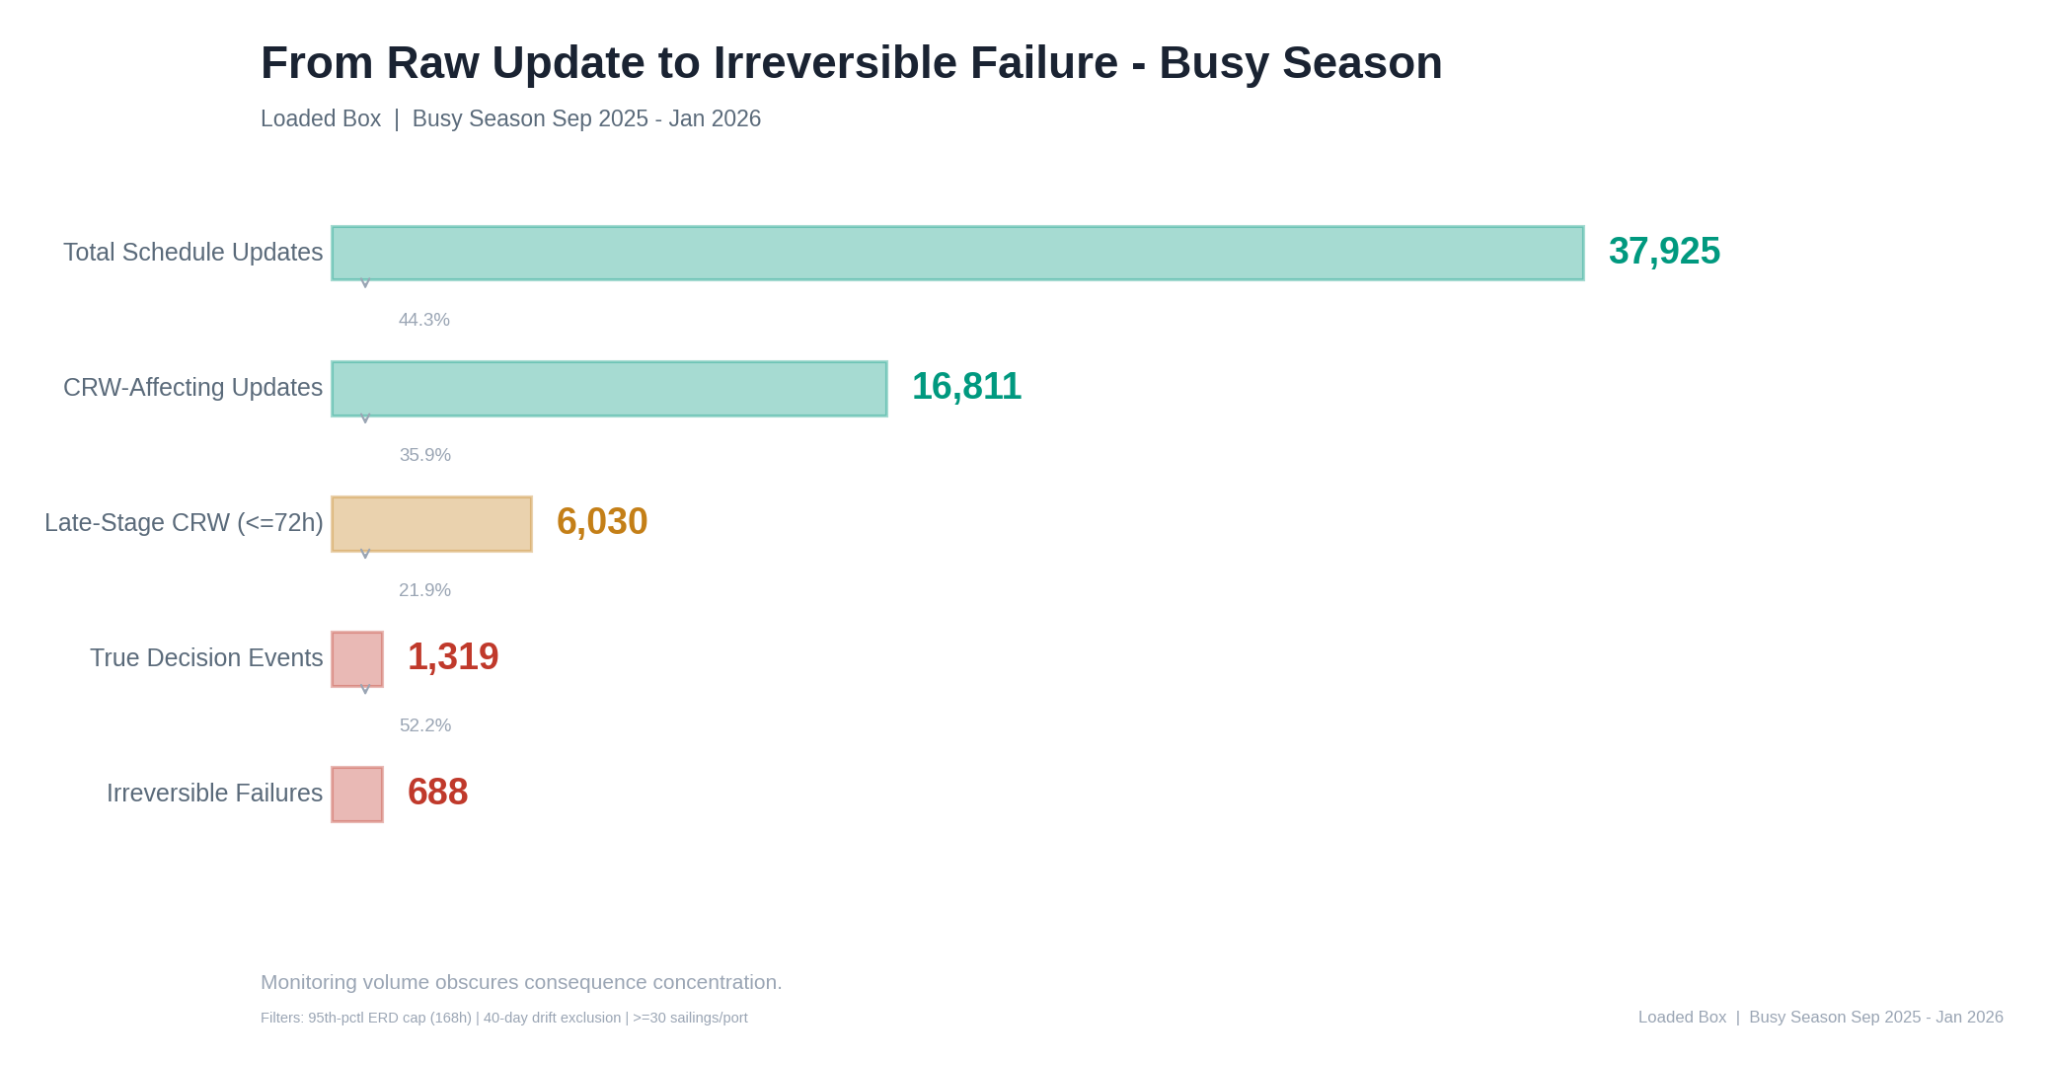
Caption: Most updates are noise. A small fraction drive consequence. Monitoring treats them the same.
How Monitoring Actually Works Today
1. Portal Refresh
Carrier portal.
Terminal website.
Email advisory.
Each publishes independently.
None reconcile automatically.
2. Spreadsheet Reconciliation
A shared file tracks:
- ERD
- CY Cut
- Notes
History is informal.
Drift is seen, not measured.
3. Morning Exception Review
“What moved?”
“Can we still make it?”
The discussion is reactive.
4. Drayage Escalation
If the window shifts inside commitment:
- Trucks rebooked
- Containers stored
- Costs absorbed
None of this is part of the monitoring loop.
The Structural Failure
Monitoring fails for five reasons.
1. It Assumes All Changes Are Equal
They are not.
A change 14 days before ERD is informational.
A change 48 hours before ERD is operationally disruptive.
Timing determines impact.
Monitoring volume is not the same as measuring boundary.
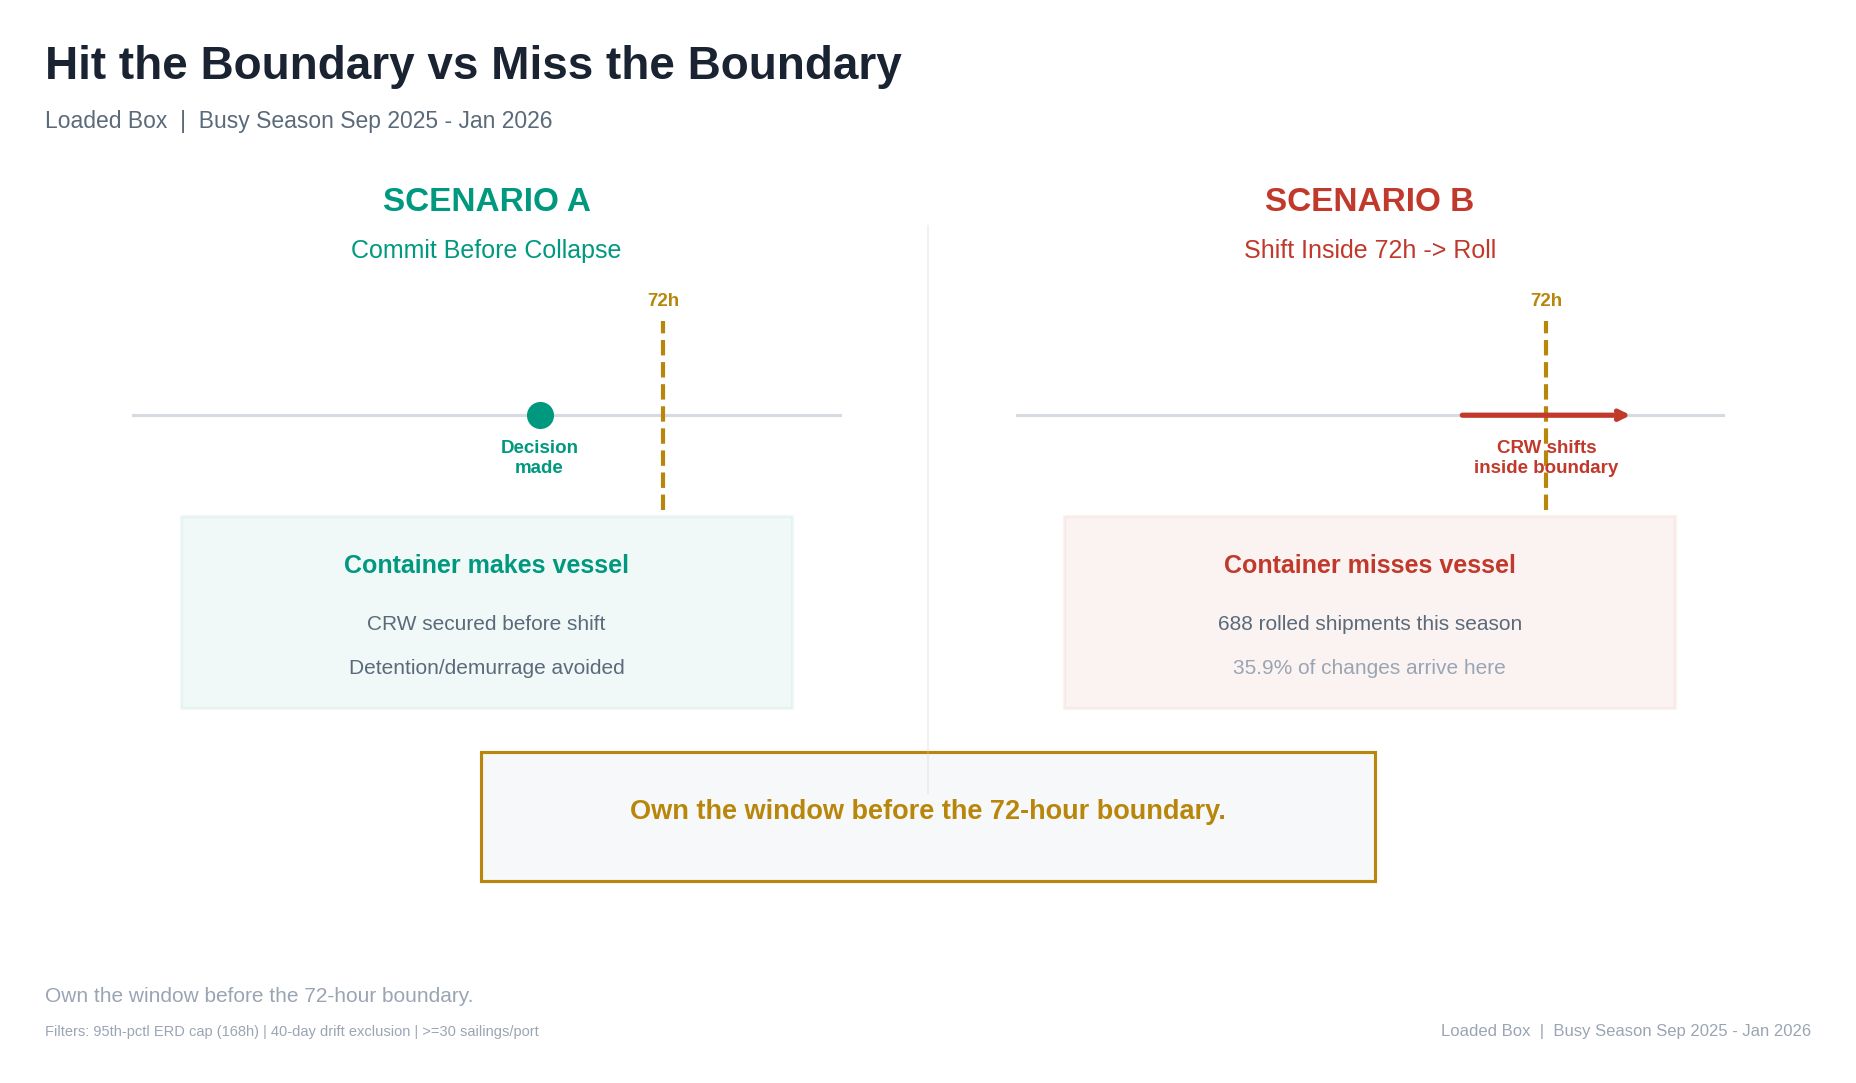
Figure 4 - The 72-Hour Boundary
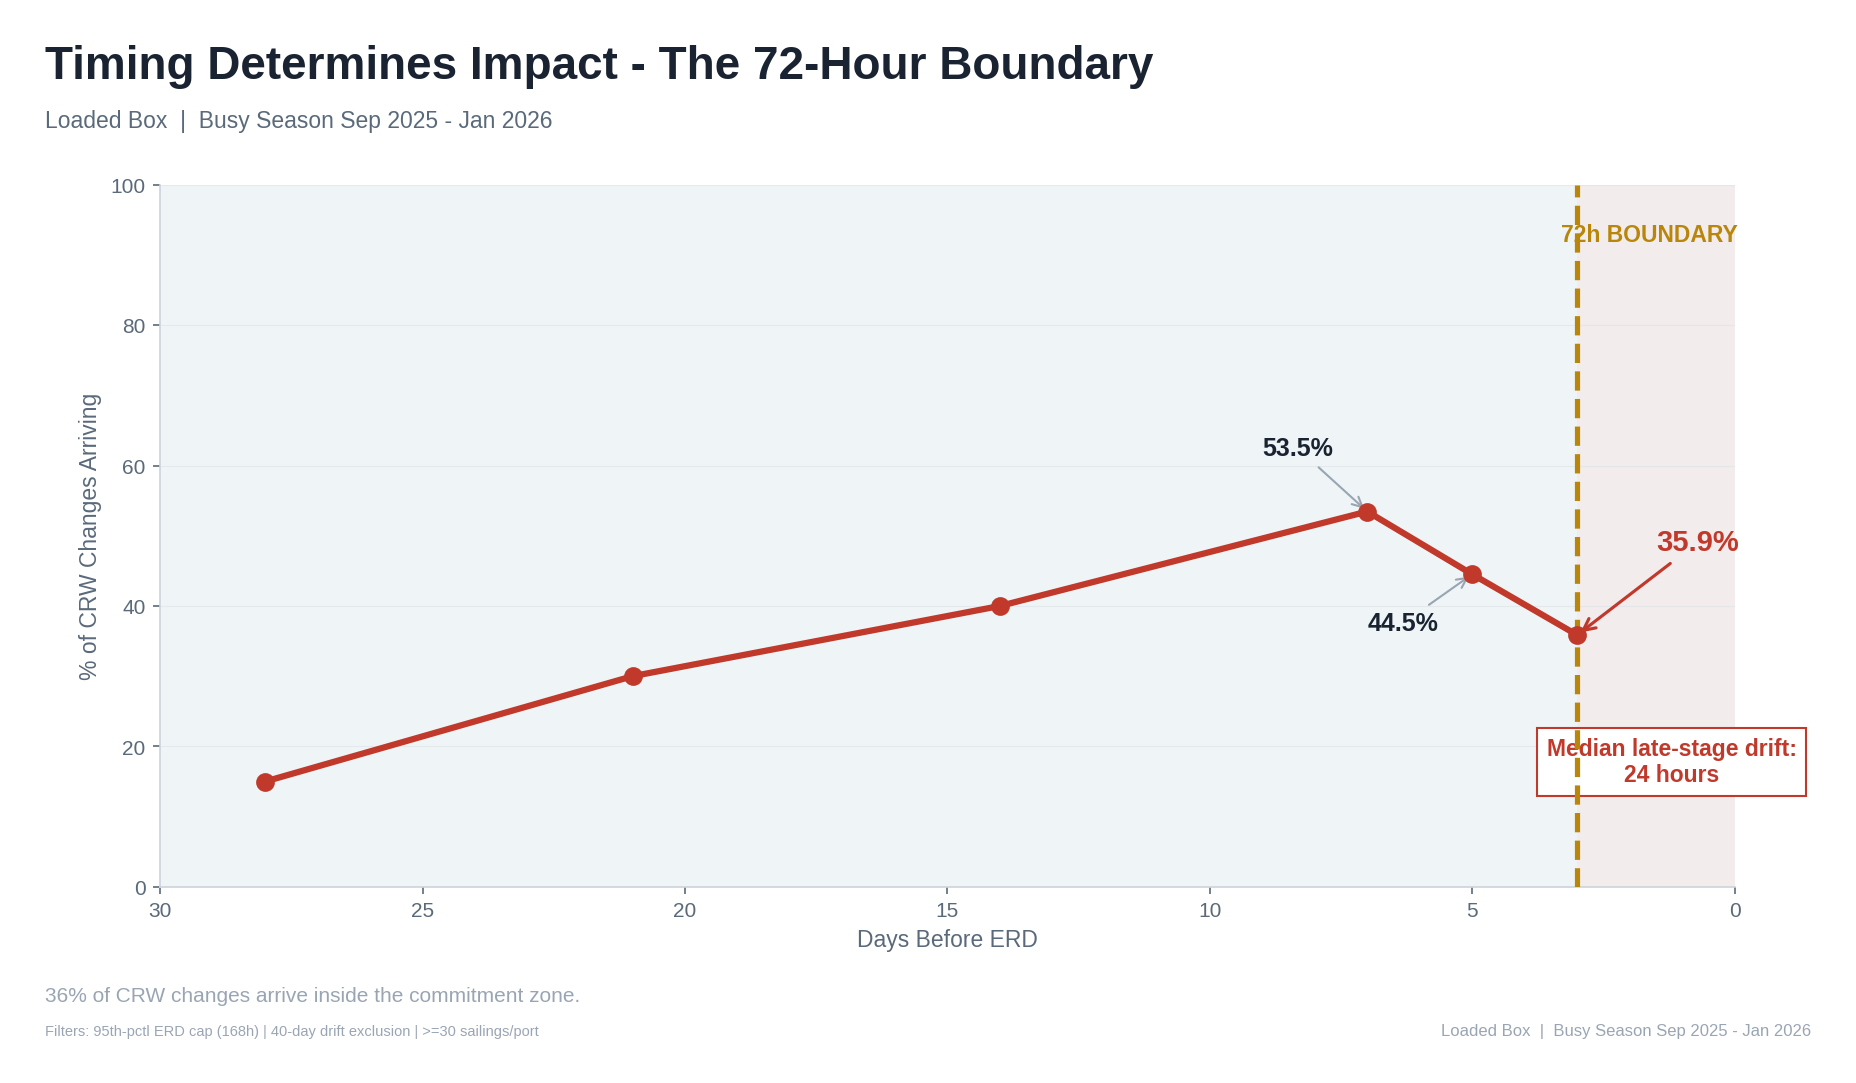
Caption: The 72-hour boundary separates manageable drift from operational disruption.
2. It Treats Noise and Signal the Same
In peak weeks:
- 4,000+ updates
- ~200 decision events
- ~50 realistic manual review capacity
Humans cannot scale with change density.
Figure 5 - Update Volume vs Decision Capacity
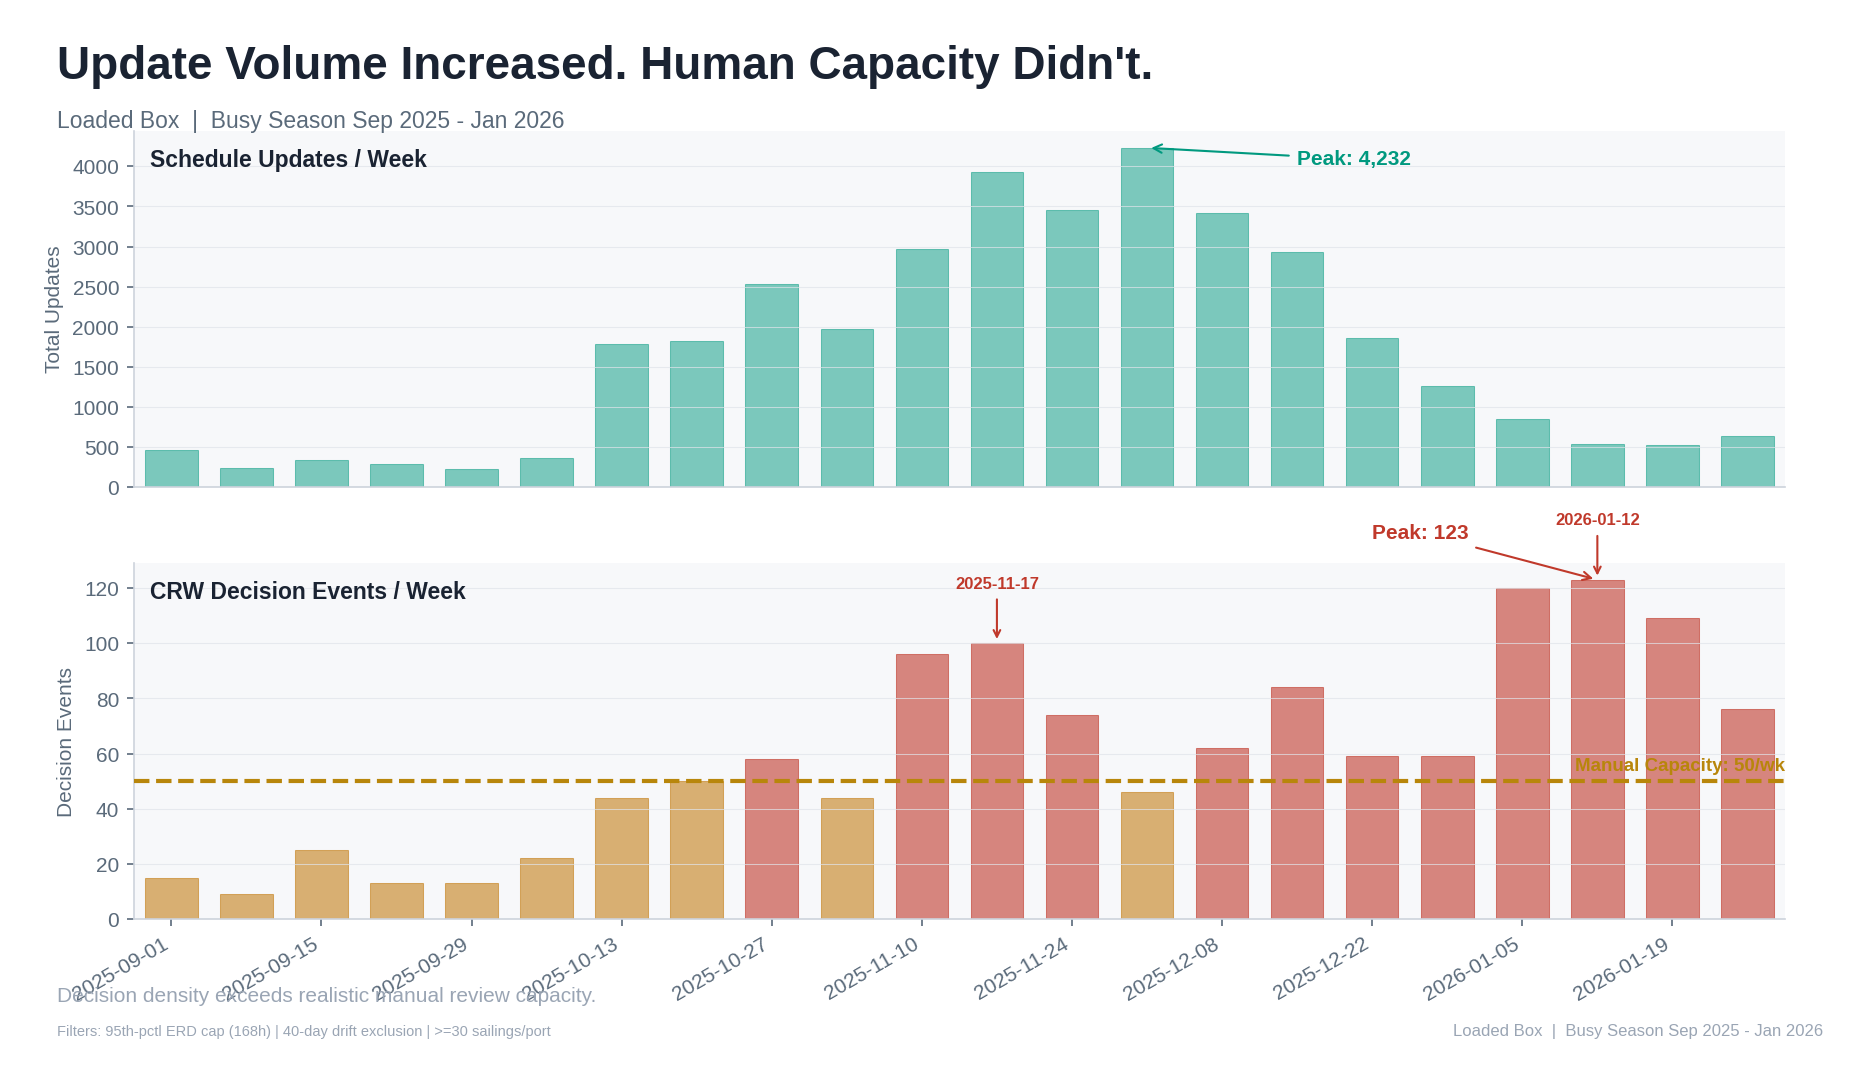
Caption: Volatility scales. Manual monitoring does not.
3. It Separates Carrier and Terminal Reality
Carrier publishes CY Cut.
Terminal publishes ERD.
Neither reconciles the boundary.
The receiving window moves through interaction.
Most teams look at these feeds independently.
Figure 6 - Boundary Drift Example
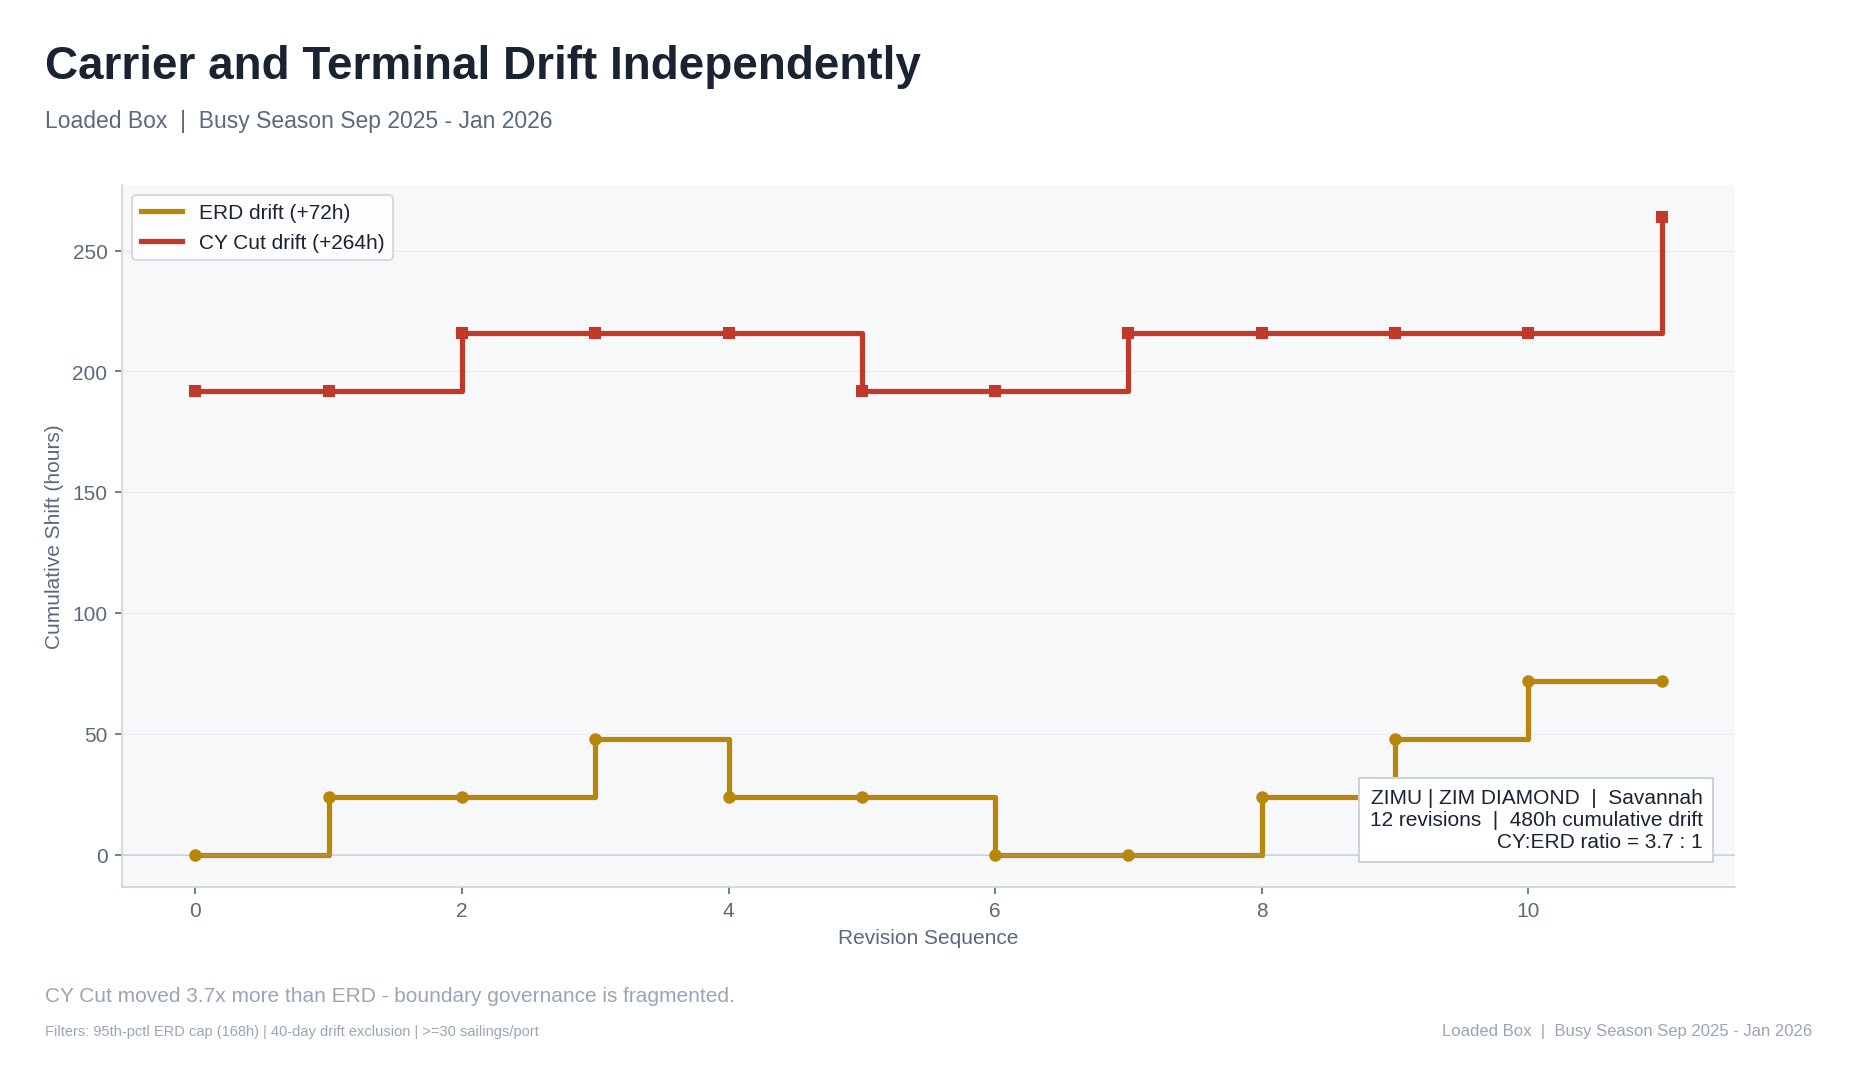
Caption: Neither source sees the full boundary. The window shifts anyway.
4. It Assumes Port Uniformity
Ports do not behave the same.
Late-stage concentration:
Houston - 17%
Savannah - 32%
Los Angeles - 56%
Charleston - 91%
A single commitment rule across gateways is mathematically incorrect.
Figure 7 - Late-Stage Concentration by Port
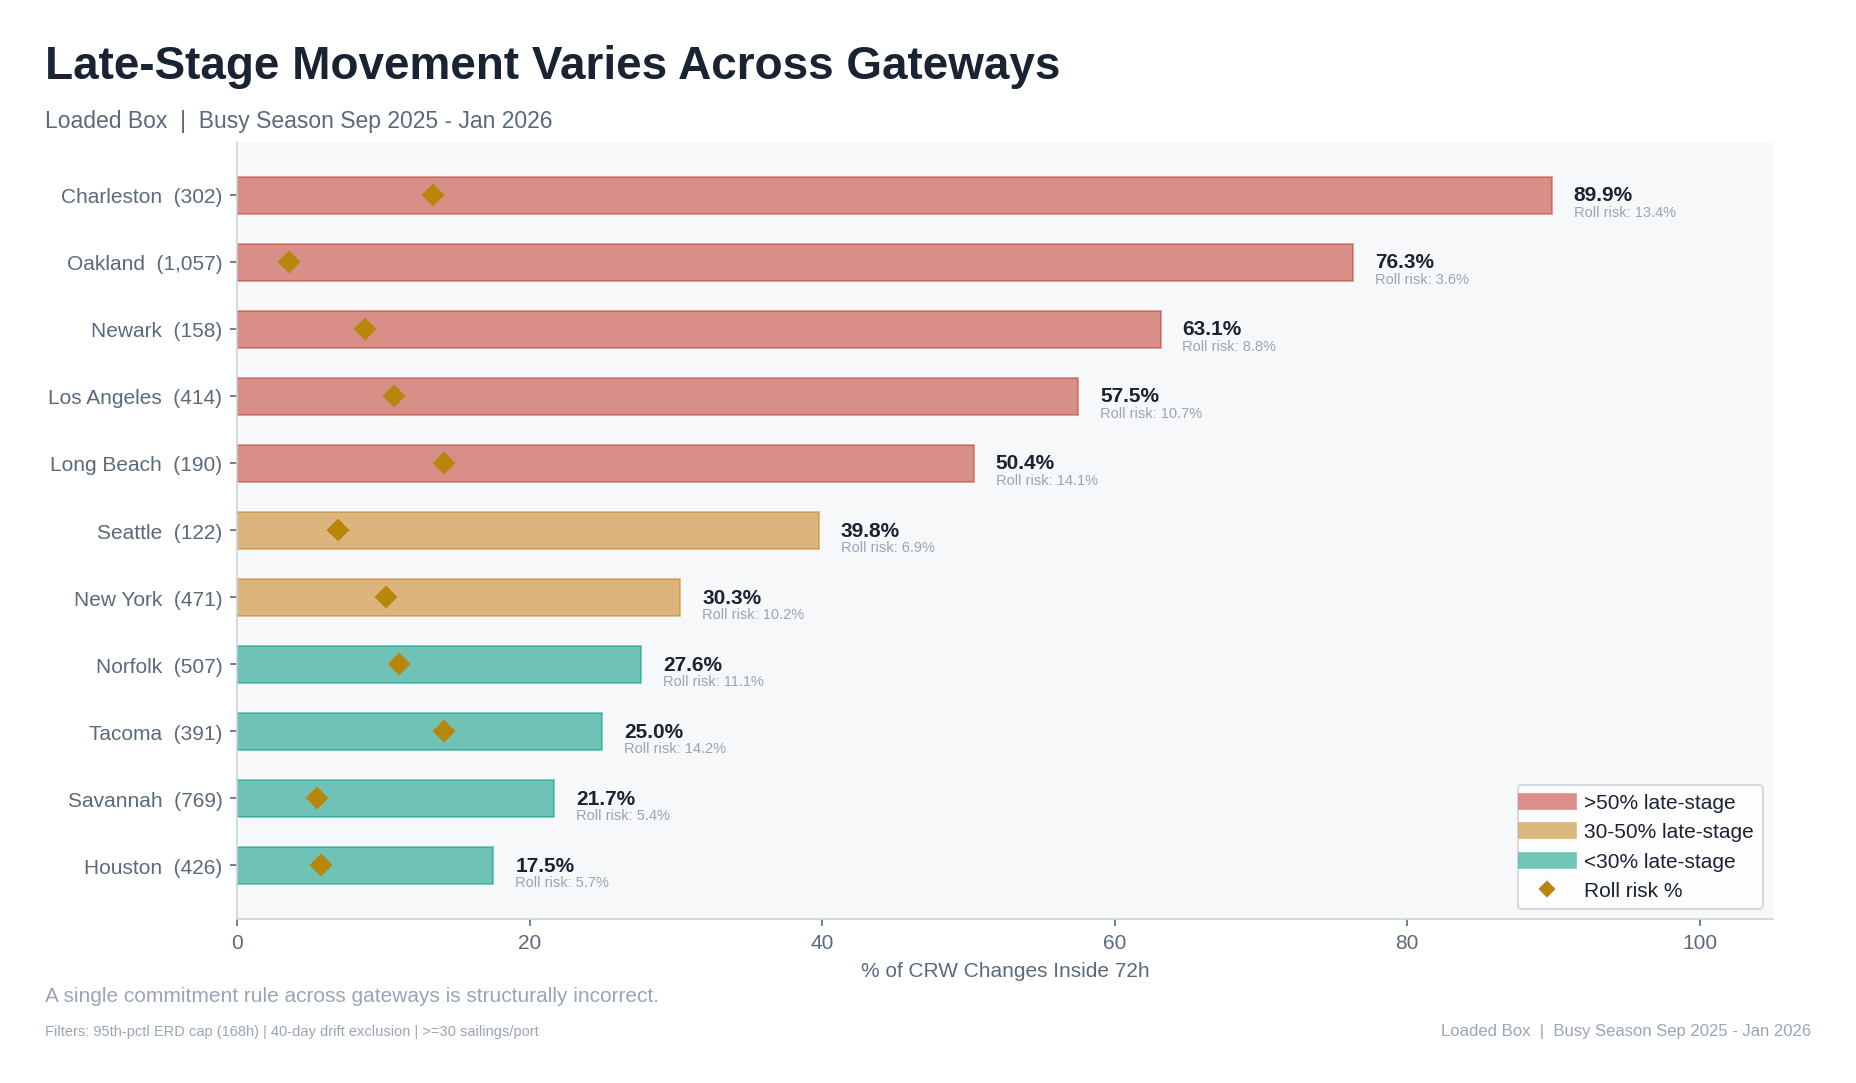
Caption: Gateway selection changes execution risk more than carrier selection in many cases.
5. It Measures Vessel Arrival - Not Window Usability
Industry reliability metrics ask:
Did the ship arrive on time?
Exporters need to know:
Can I still deliver my container when I planned to?
These are different questions.
Figure 8 - On-Time Vessel, Compressed Window
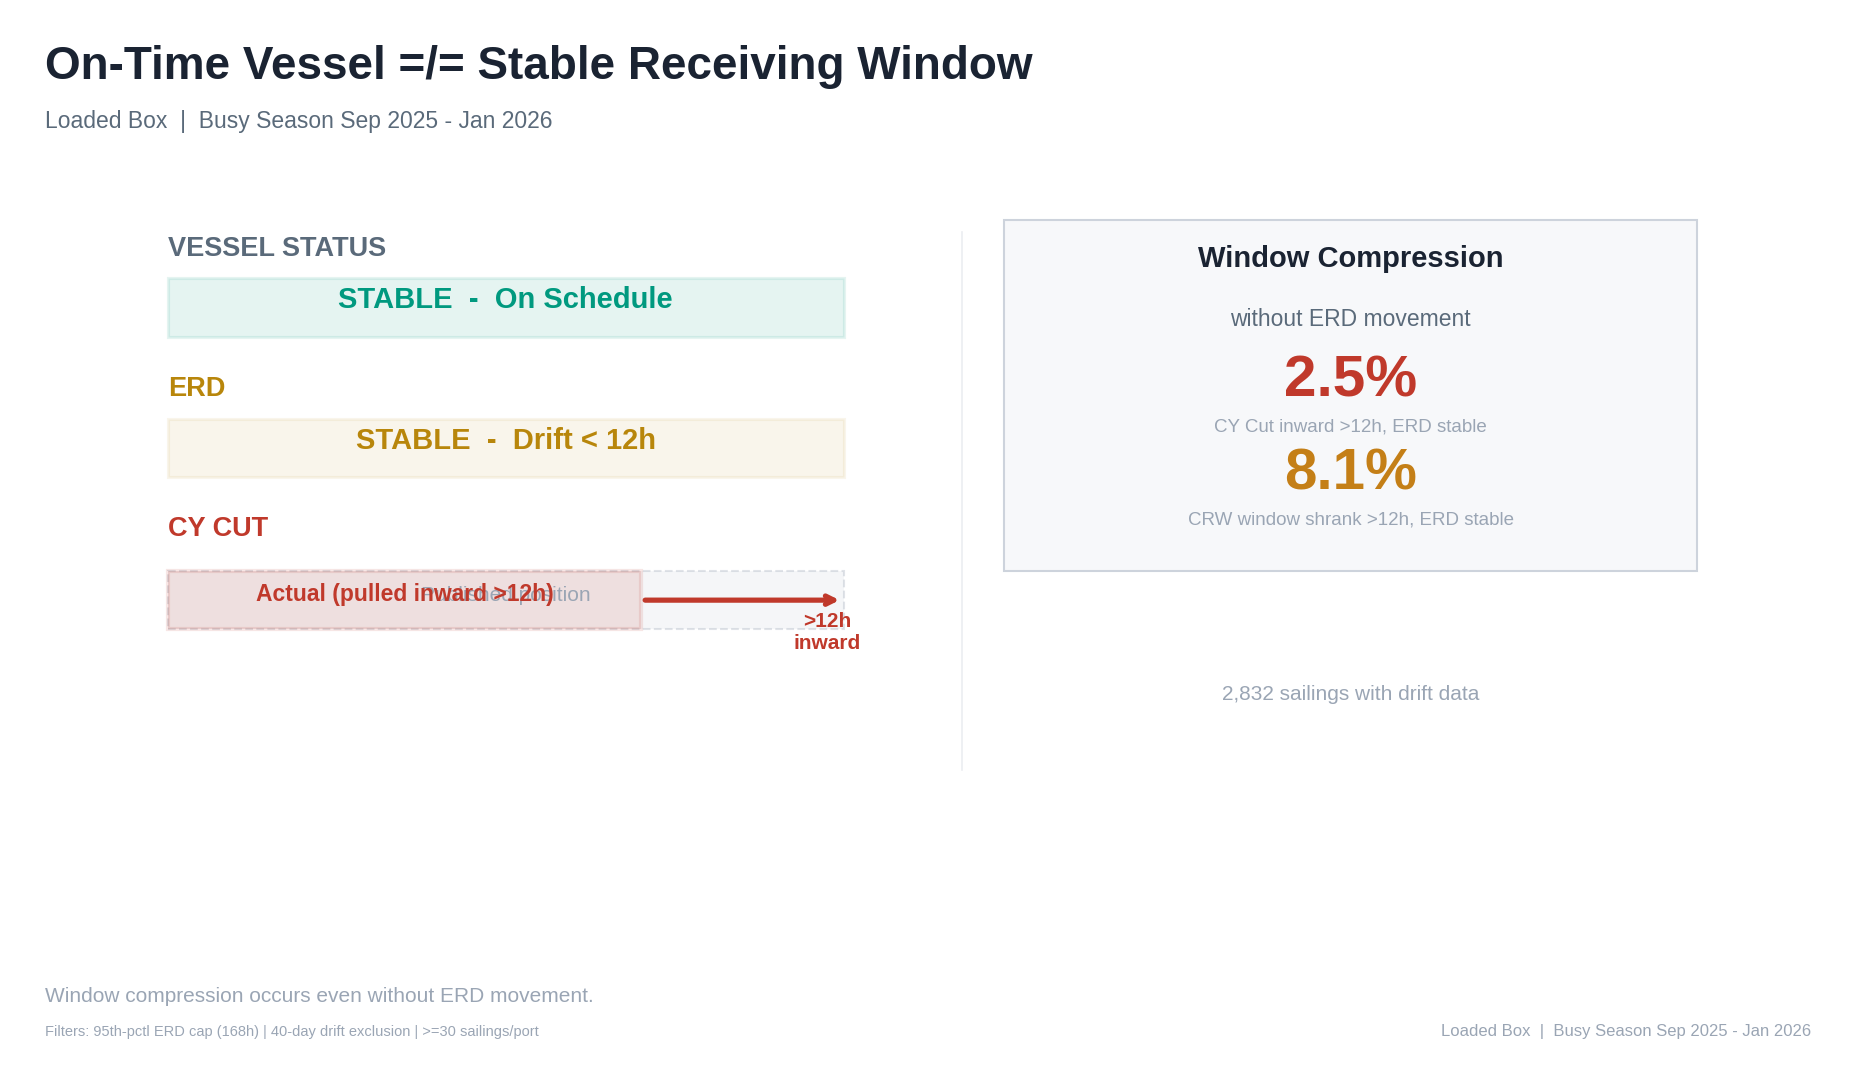
Caption: The vessel arrived. The usable window collapsed.
The Silent Failure Mode
The most expensive failures are not dramatic.
They are silent rolls.
- The vessel sails.
- The schedule shows “on time.”
- The container misses the cutoff.
- The cost is absorbed downstream.
Monitoring sees arrival time.
It does not measure boundary compression.
What a Modern Monitoring Model Must Do
If volatility is structural, monitoring must evolve.
It must:
- Separate noise from decision events.
- Track timing concentration.
- Reconcile ERD and CY Cut as a single boundary.
- Quantify port-specific commitment thresholds.
- Translate volatility into corridor-level risk.
Monitoring is no longer about awareness.
It is about boundary governance.
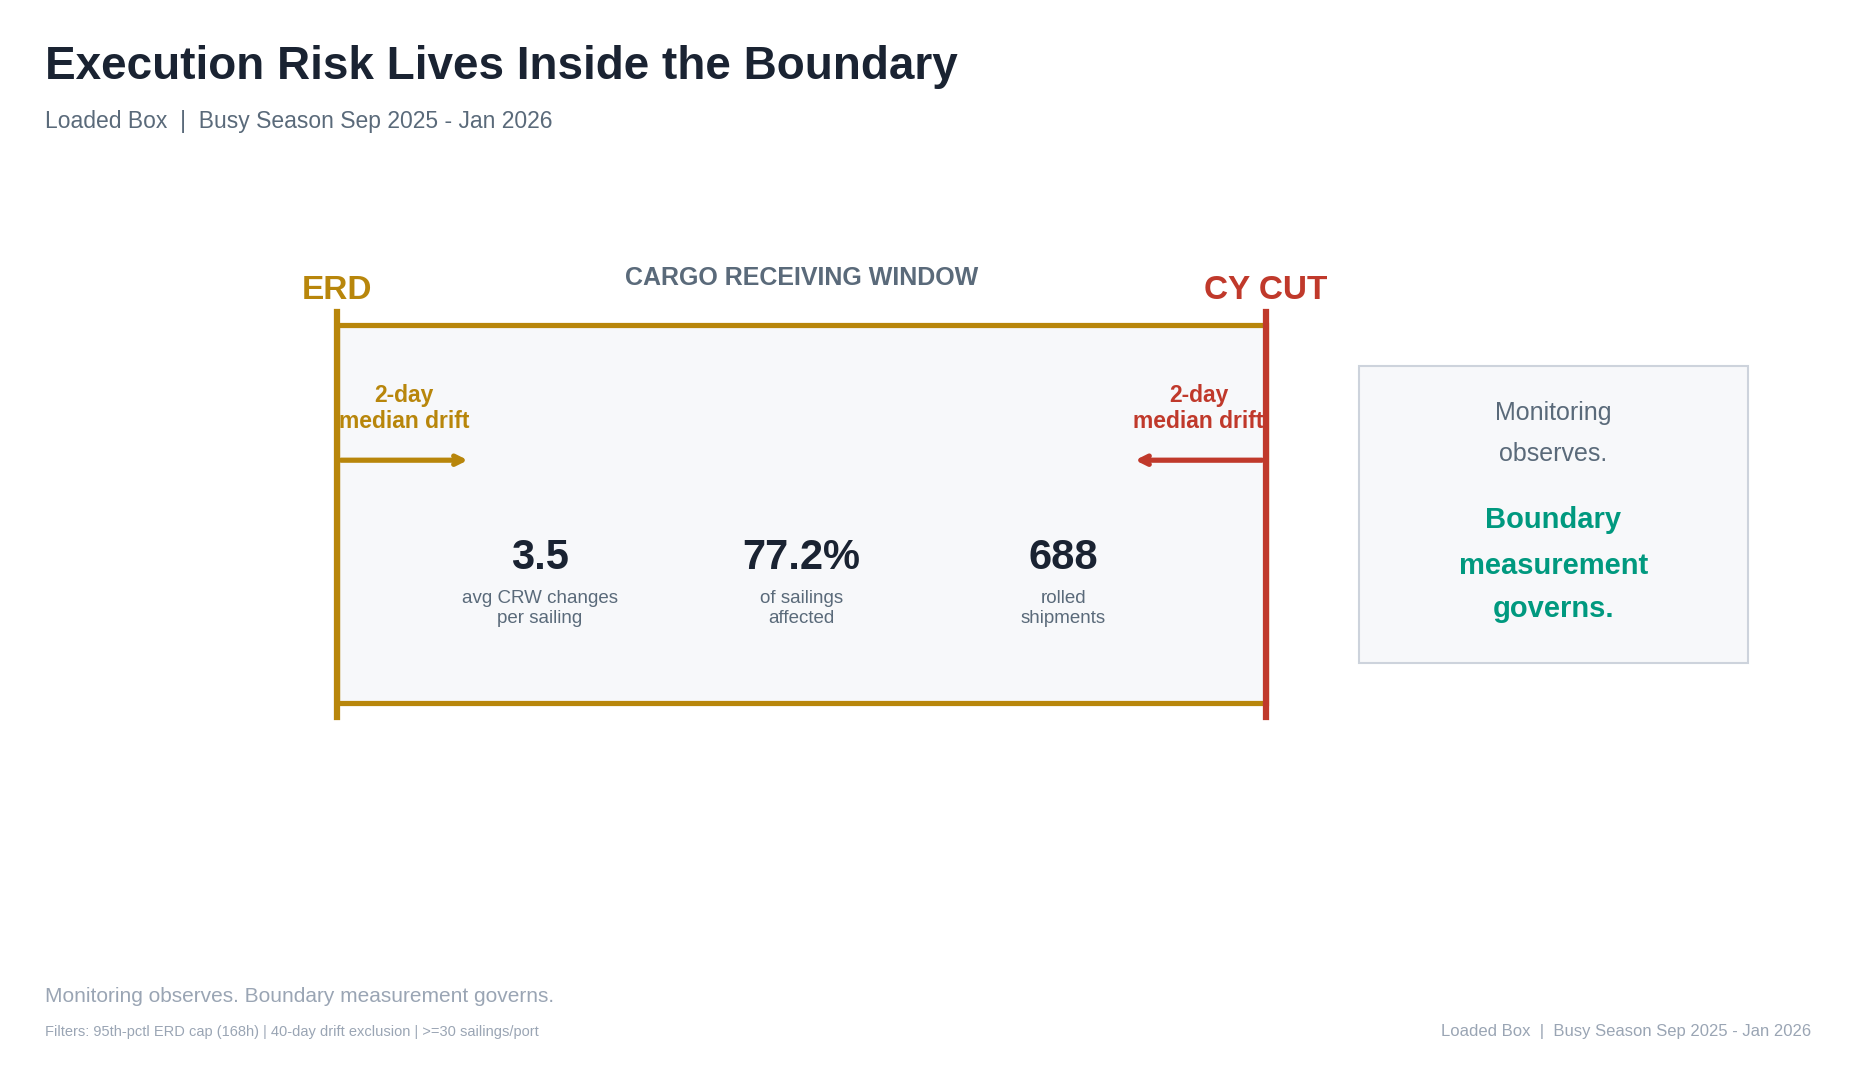
Figure 9 - Boundary Governance Model
Caption: Execution risk lives inside this boundary.
The Reframe
The wrong question:
“Did the vessel move?”
The right question:
“Did my usable receiving window collapse inside the commitment zone?”
Once you measure that boundary consistently:
- Commitment timing becomes disciplined.
- Drayage booking becomes structured.
- Port selection becomes data-driven.
- Contract alignment becomes possible.
Without measurement, monitoring remains observational.
Observational monitoring always lags consequence.
Figure 10 - Execution Risk Lives Inside the Boundary
Closing
Most export teams monitor schedules.
Very few measure window stability.
The difference is operational.
As volatility increases, the gap widens.
Monitoring does not fail because teams are inattentive.
It fails because the architecture is outdated.
And outdated architecture eventually becomes margin.


Leave a Comment