869, to be exact.
869 of those vessel schedule changes don’t matter - and the ones that do come too late.
For every 100 shipments, there are over 1,200 vessel schedule changes.
Most don’t matter.
And the ones that do come too late.
That’s how operators experience it.
In the data, that same pattern shows up differently:
-
18,180 schedule updates
-
2,114 actual decisions
Intro - The Compression Problem
Most export teams are overwhelmed by schedule updates.
But the real problem isn’t volume.
It’s timing.
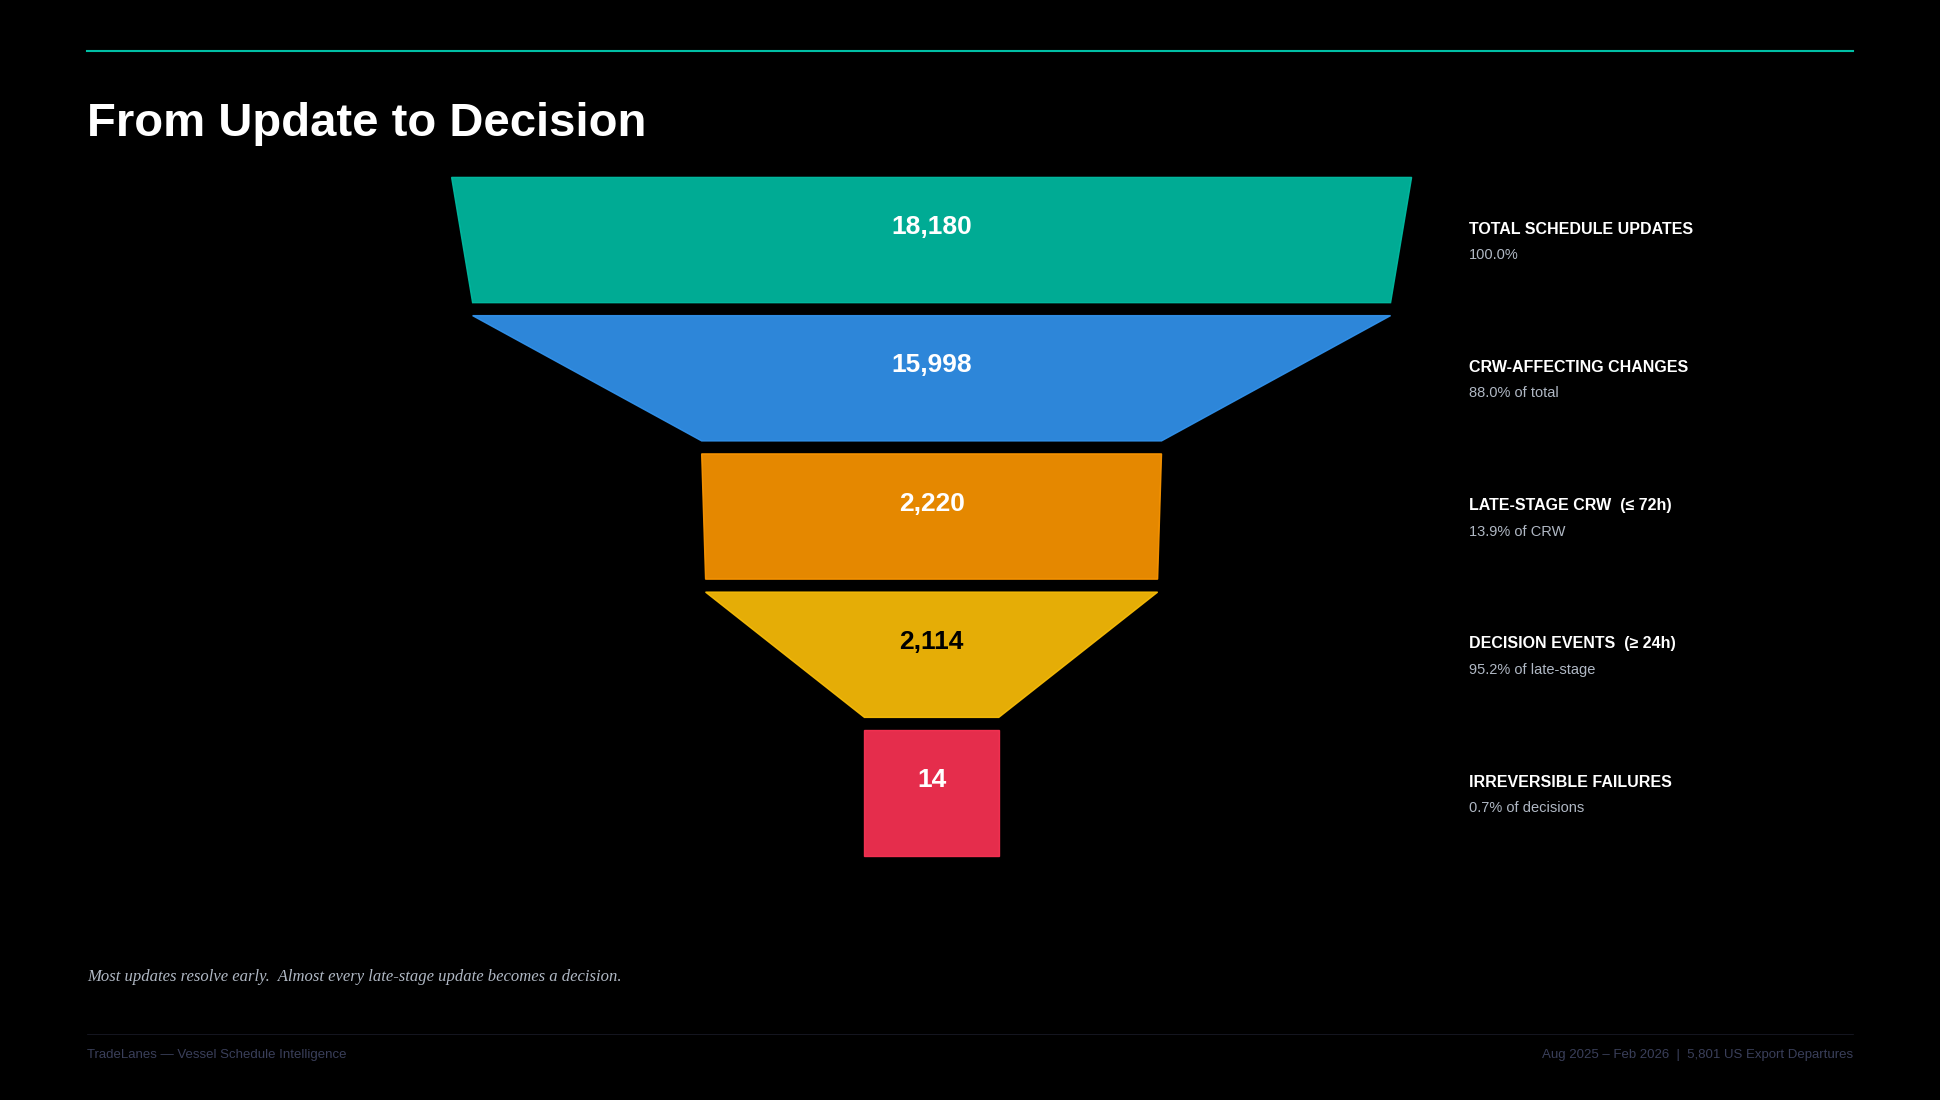
Between August 1, 2025 and February 28, 2026:
- 5,801 U.S. export sailings
- 18,180 filtered schedule updates
- 15,998 changes that directly affected the Cargo Receiving Window
But only:
- 2,220 arrived inside the final 72 hours
- 2,114 were large enough to force a decision
- 14 resulted in confirmed window collapse
The system is not noisy.
It is compressed.
Figure 1 - Decision Funnel
Most updates do not require action. Almost every late-stage update does.
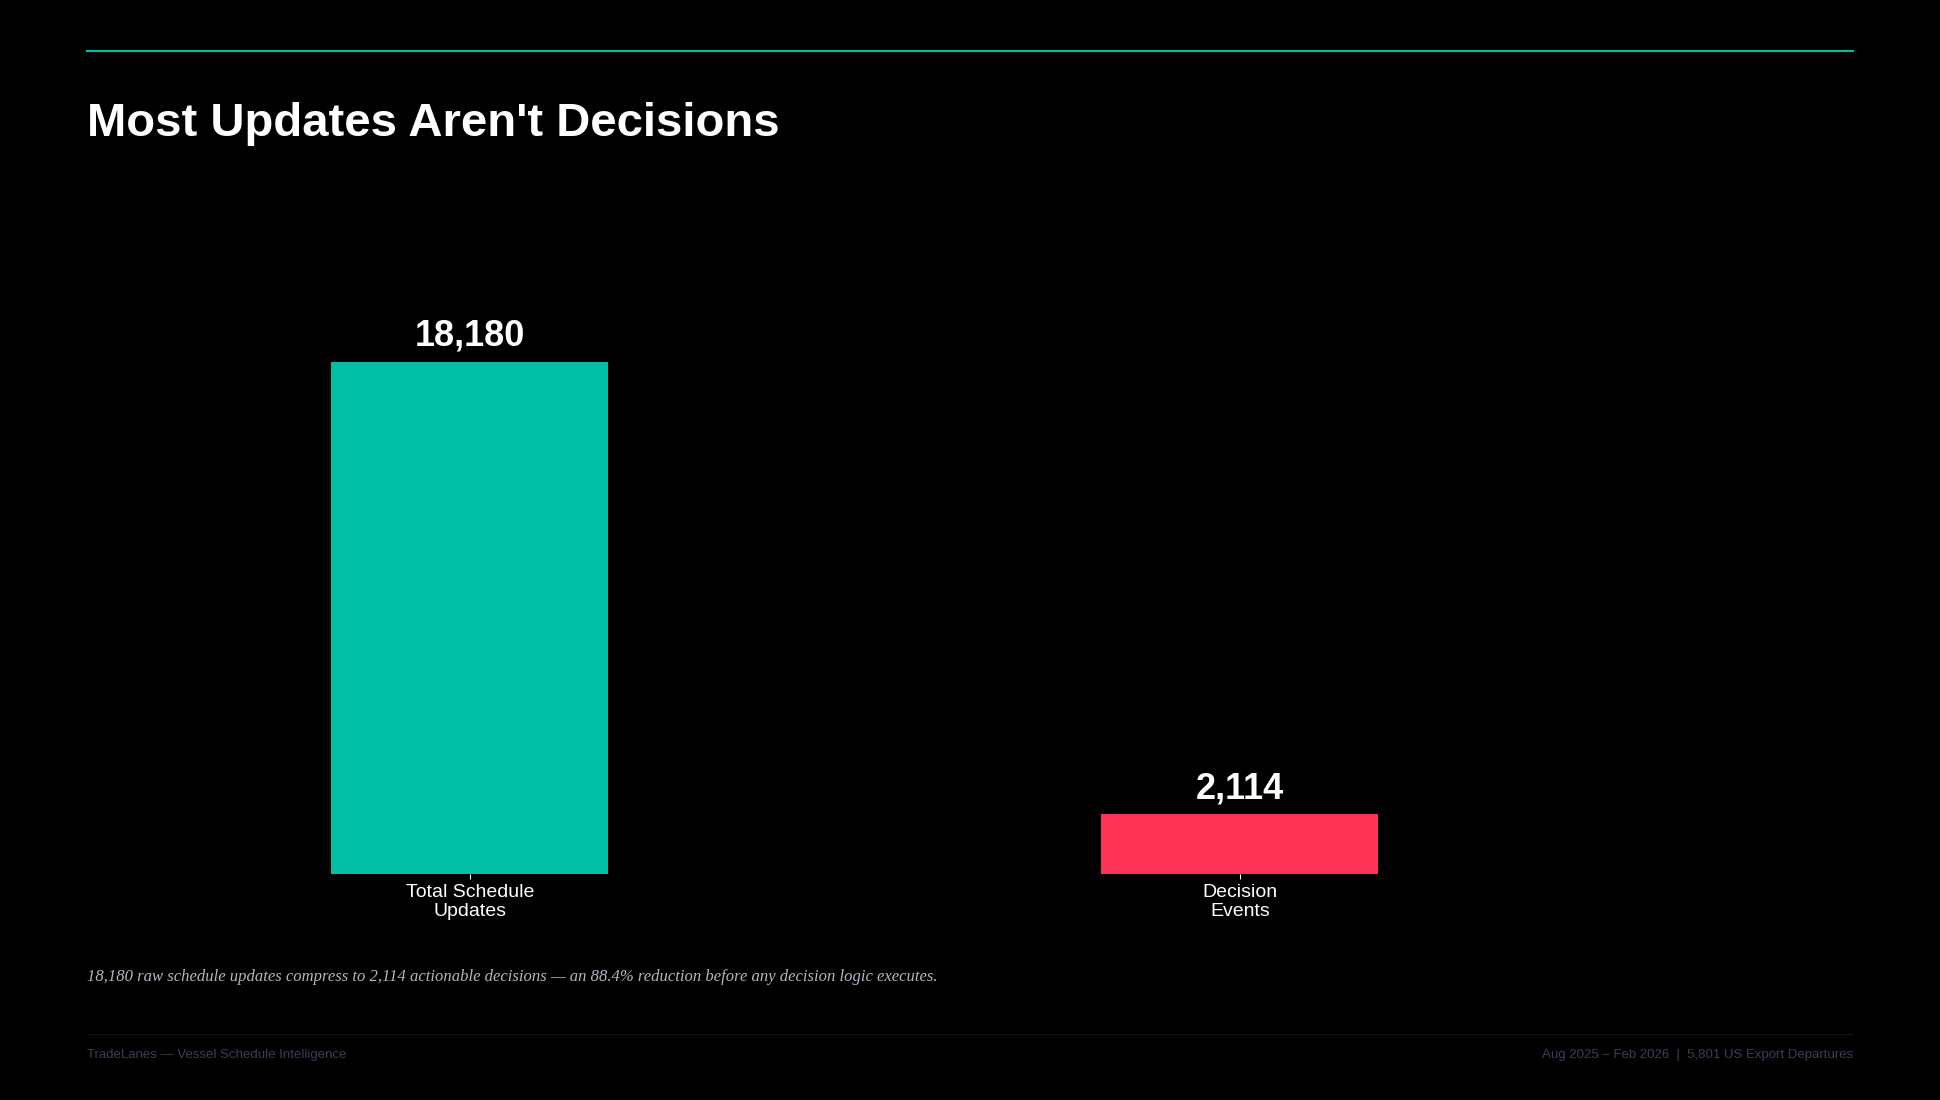
Most Updates Are Not Decisions
The funnel removes 88.4% of all updates.
That is the first structural insight.
Most schedule movement happens:
- Early in the planning cycle
- In small increments
- With time to adjust
This is informational drift.
Not operational pressure.
Figure 2 - Signal Compression
Monitoring volume is not the same as measuring risk.
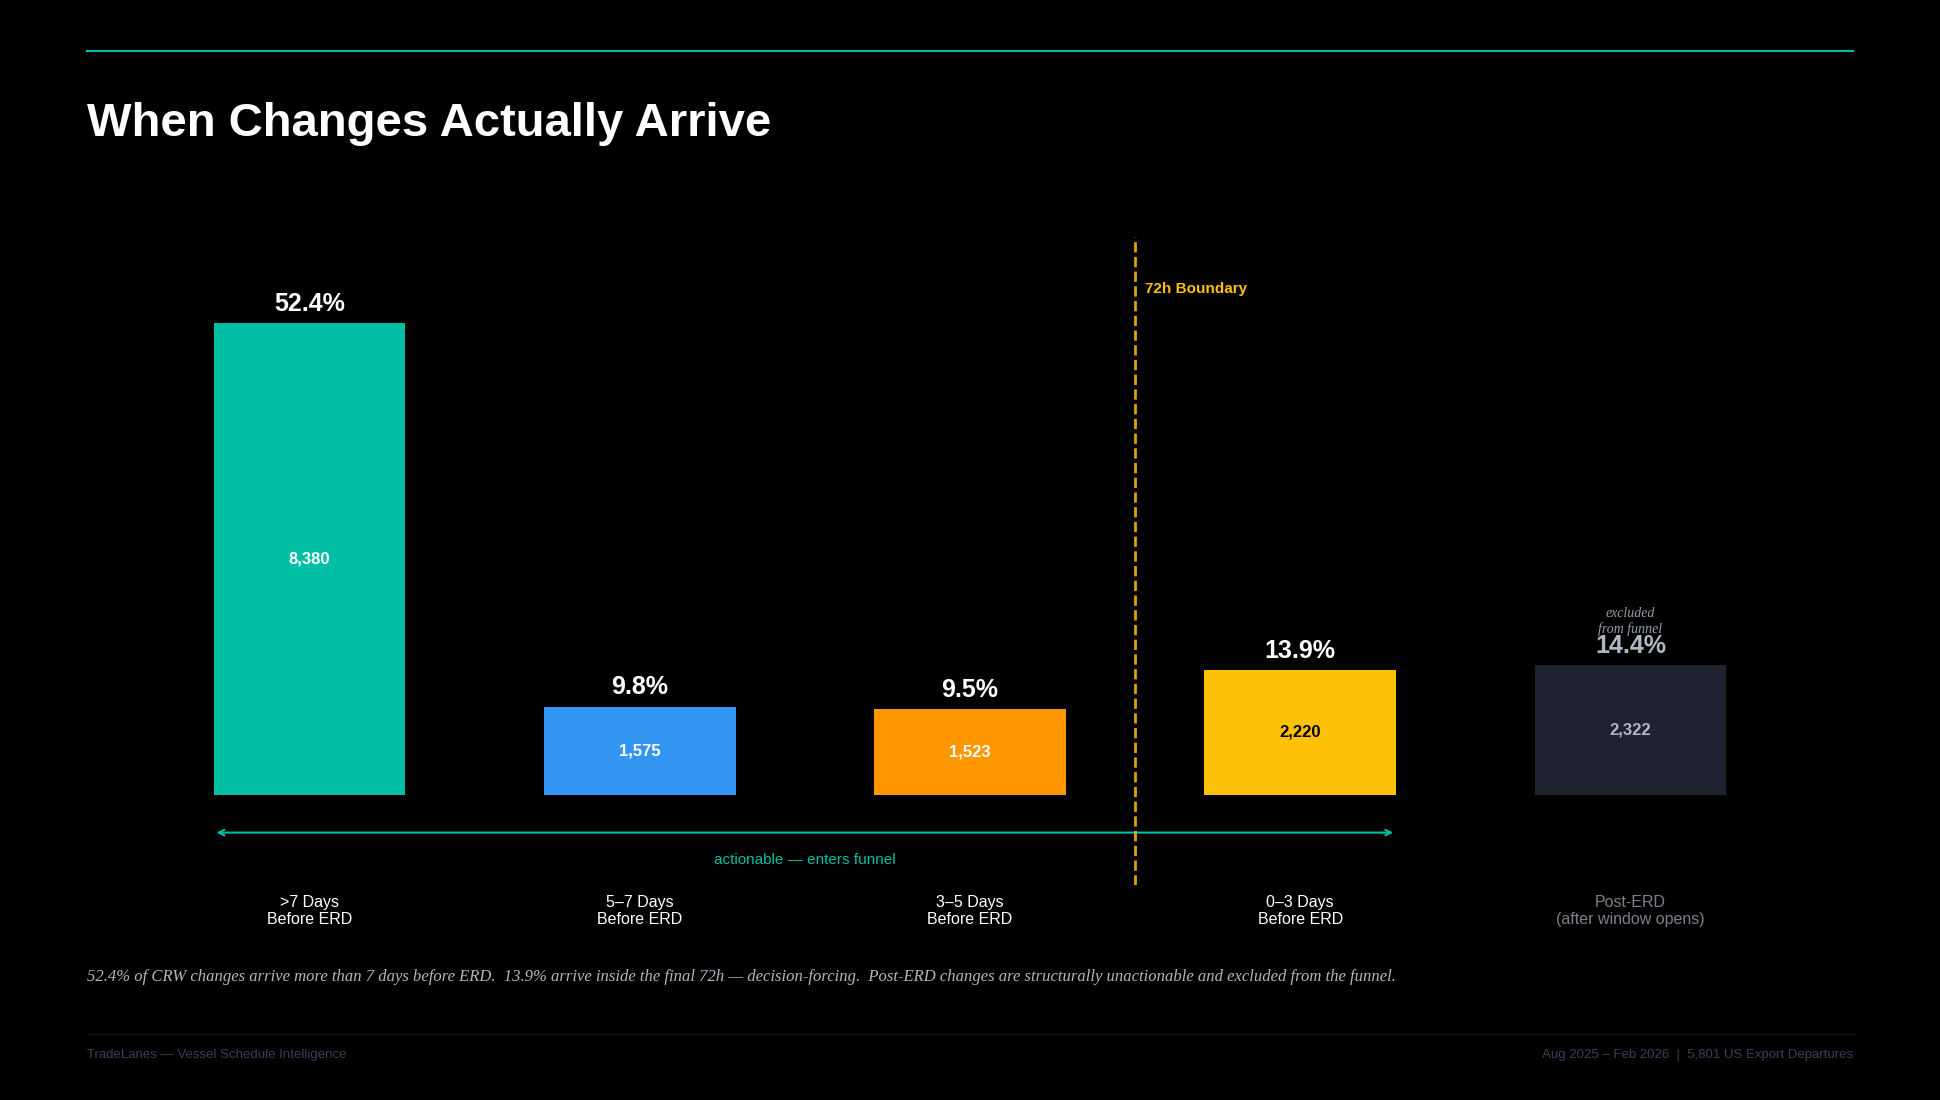
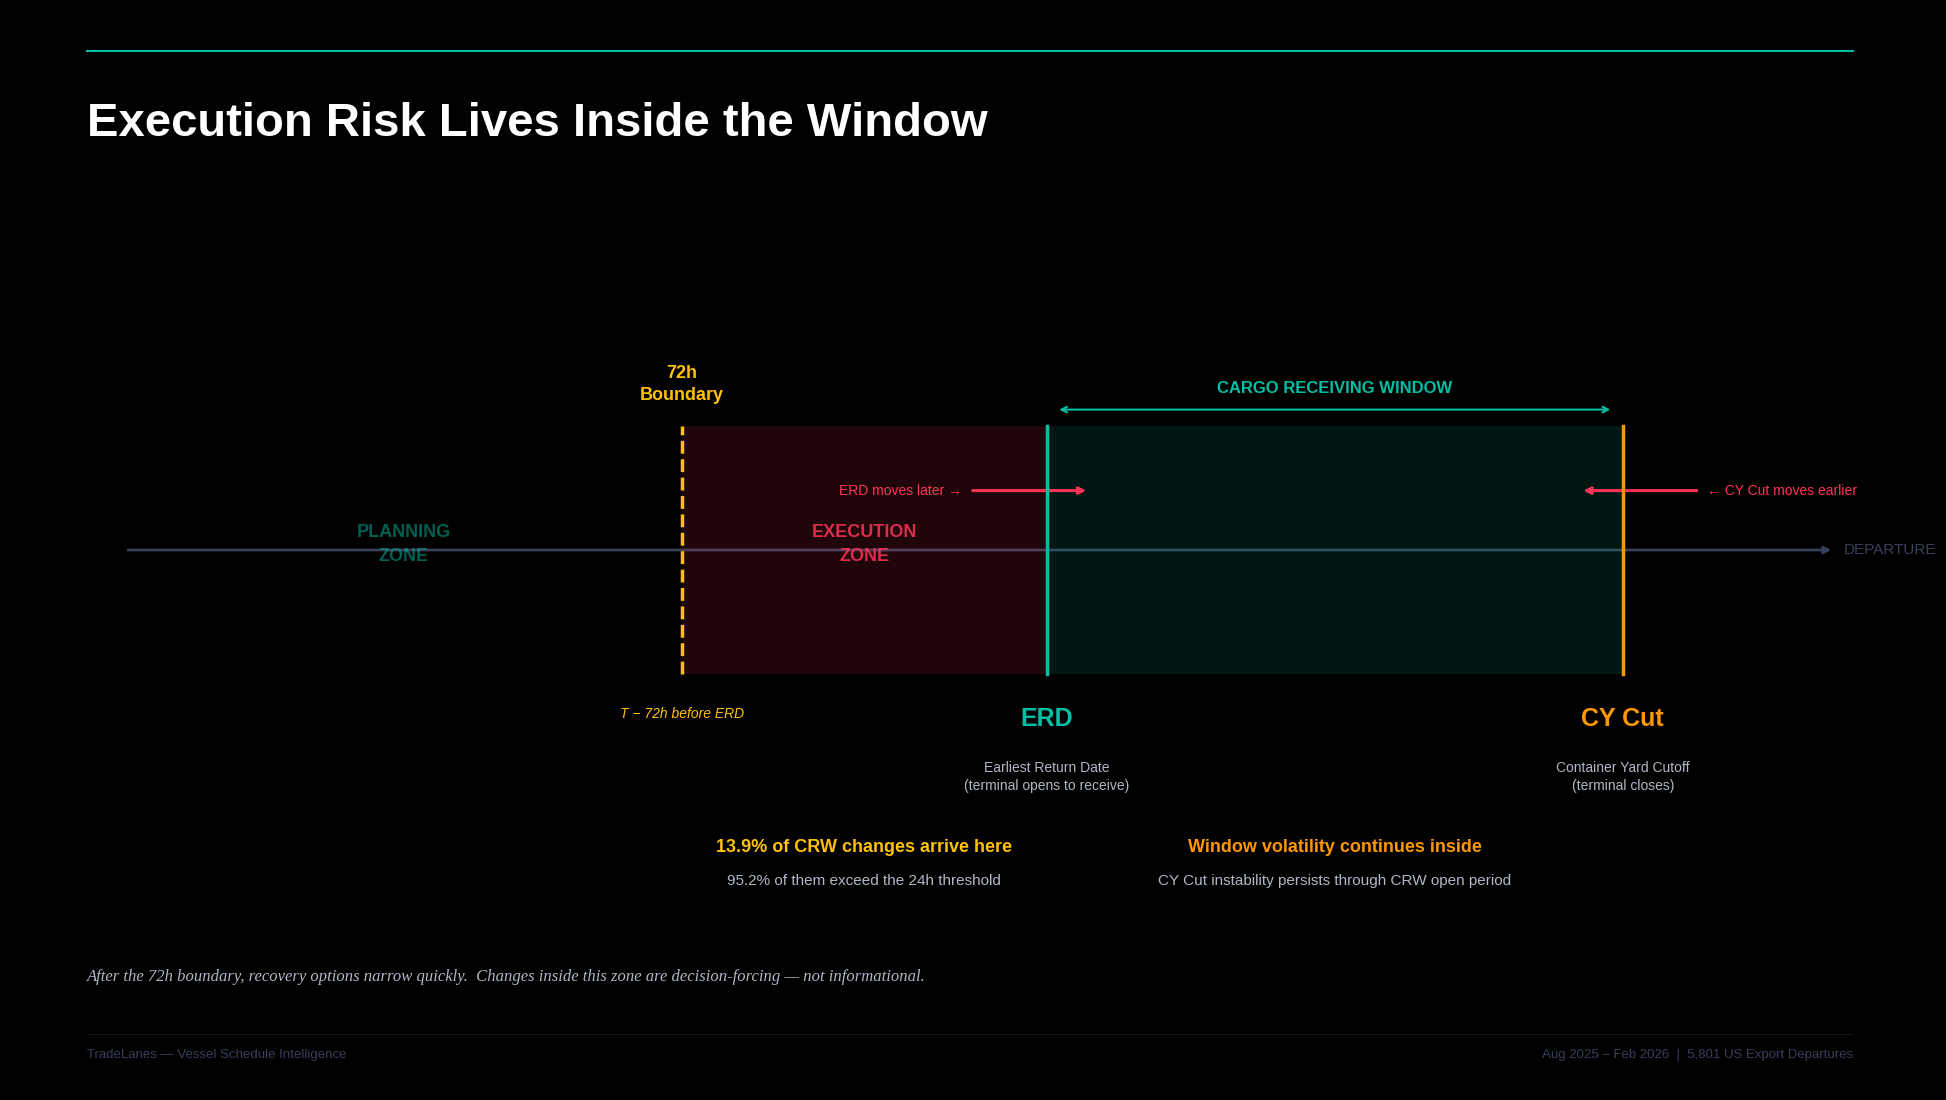
The 72-Hour Boundary Changes Everything
Inside the final 72 hours:
- 95.2% of changes exceed 24 hours
- Almost every change becomes operational
There is no gradual adjustment.
There is no buffer.
There is only compression.
Figure 3 - Timing Distribution Curve
The boundary is not frequency. It is proximity to execution.
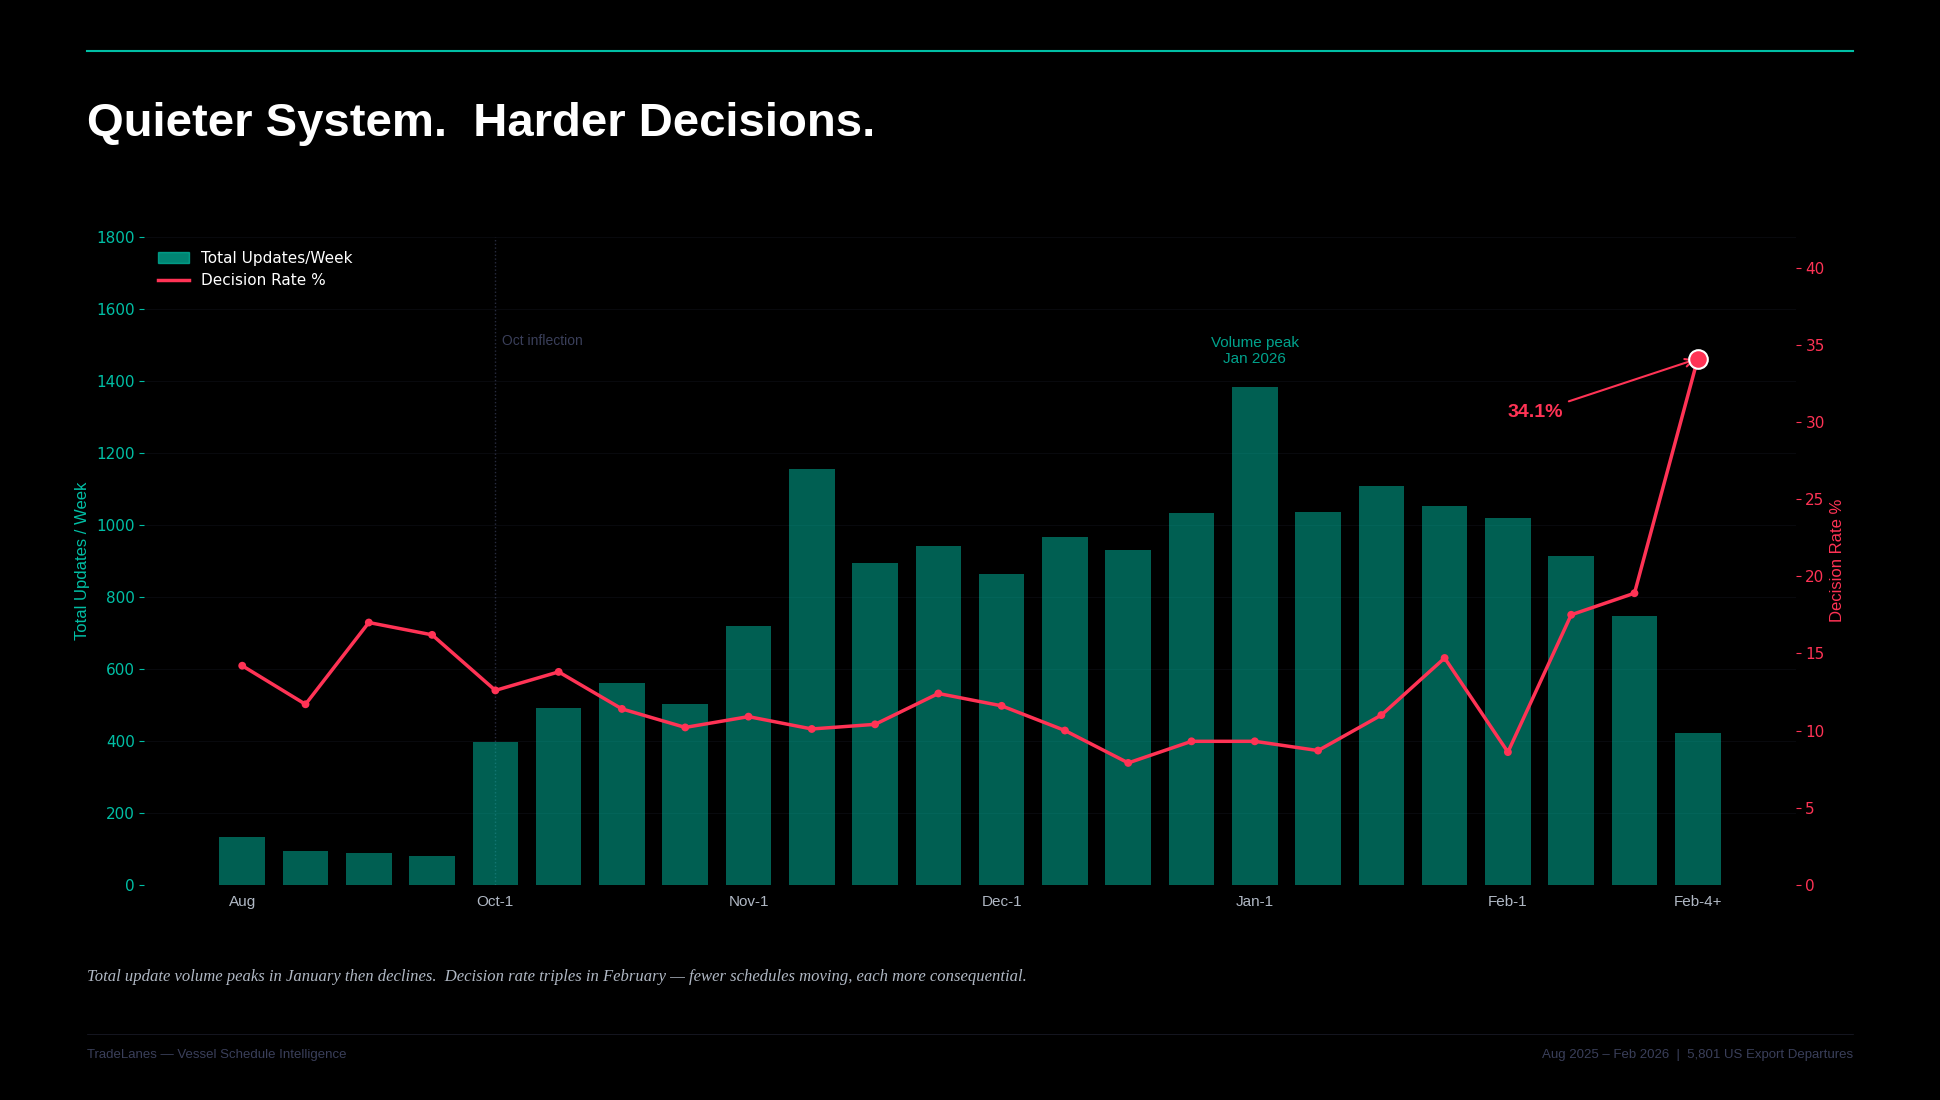
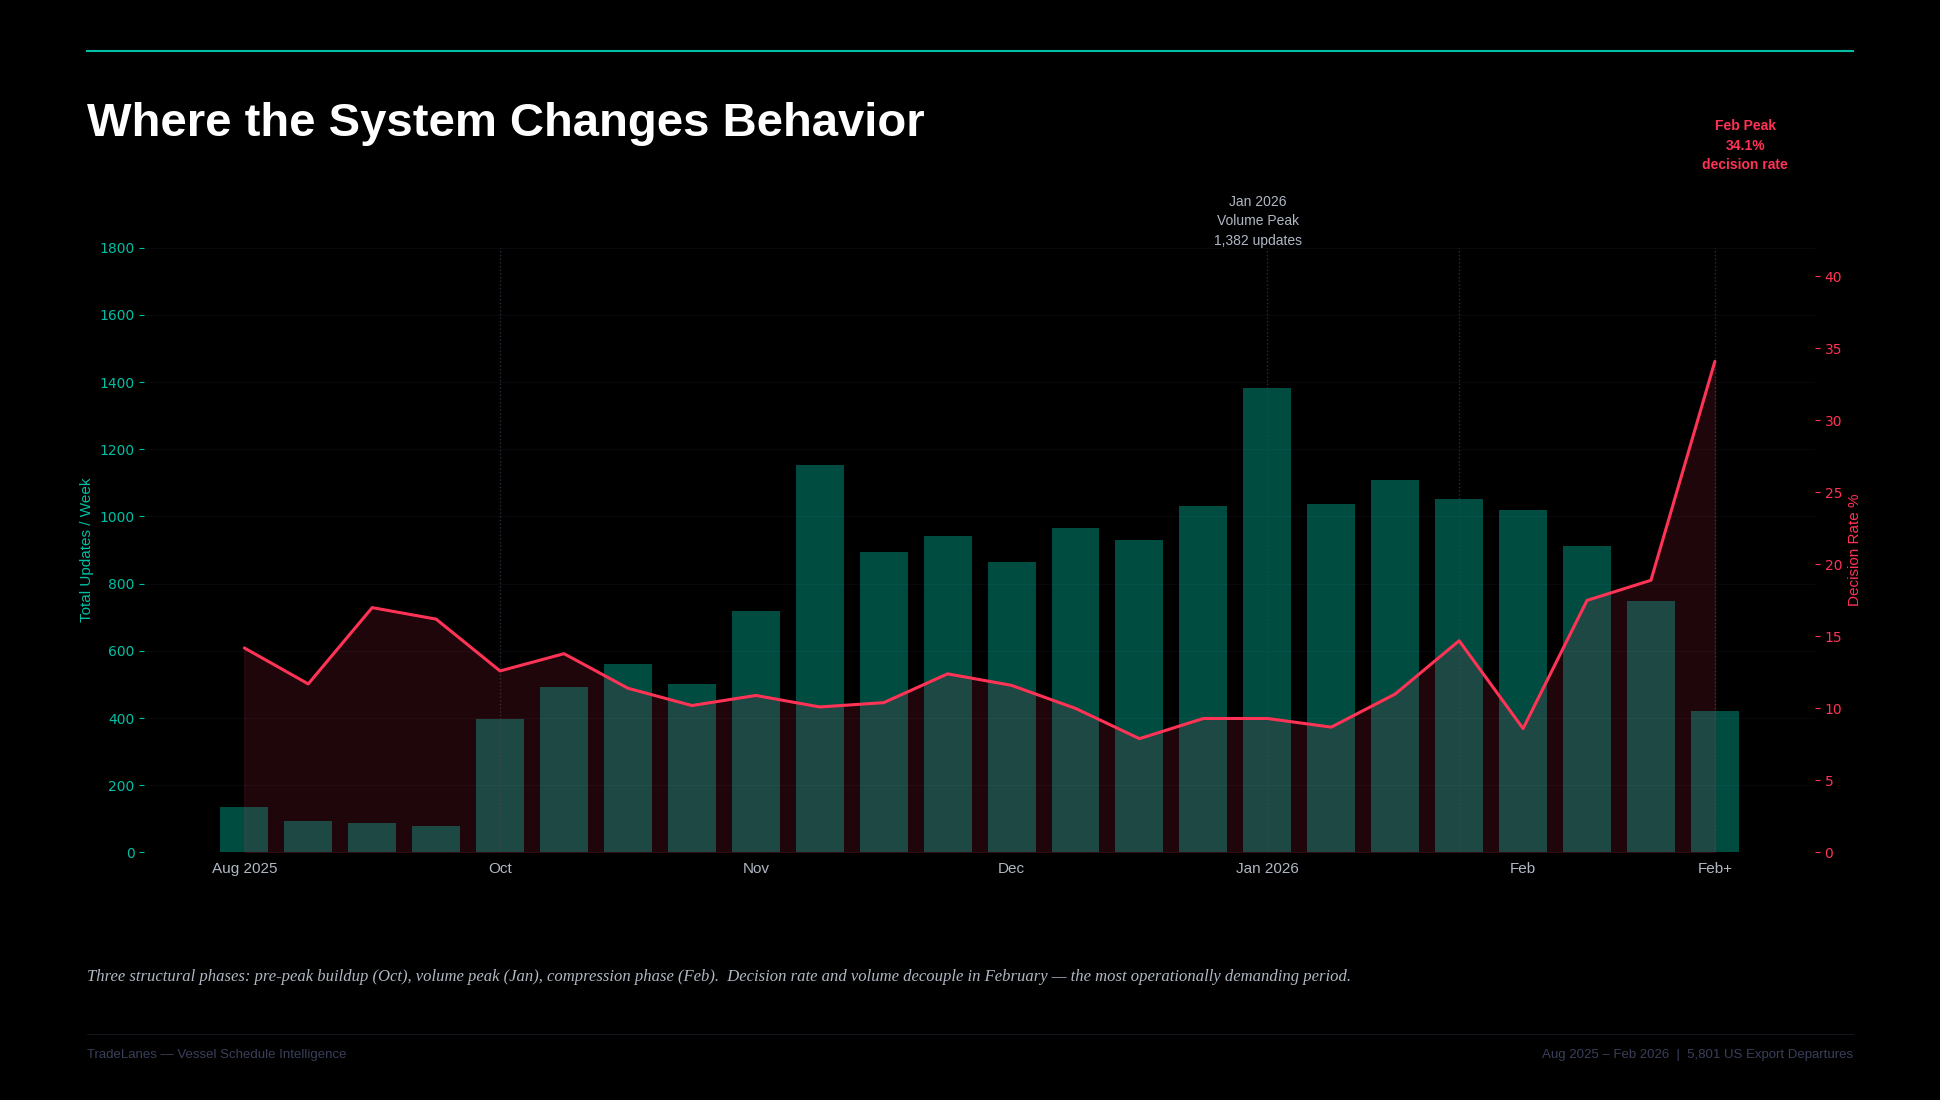
Decision Density Increases as Volume Falls
This is the counterintuitive finding.
- Early January: highest update volume
- Late February: highest decision density
By the final week:
- Only 422 updates
- 144 decisions
- 34.1% decision rate
- 41.7% late-stage concentration
Fewer updates.
More pressure.
Figure 4 - Volume vs Decision Rate Over Time
Volume declines. Decision pressure increases.
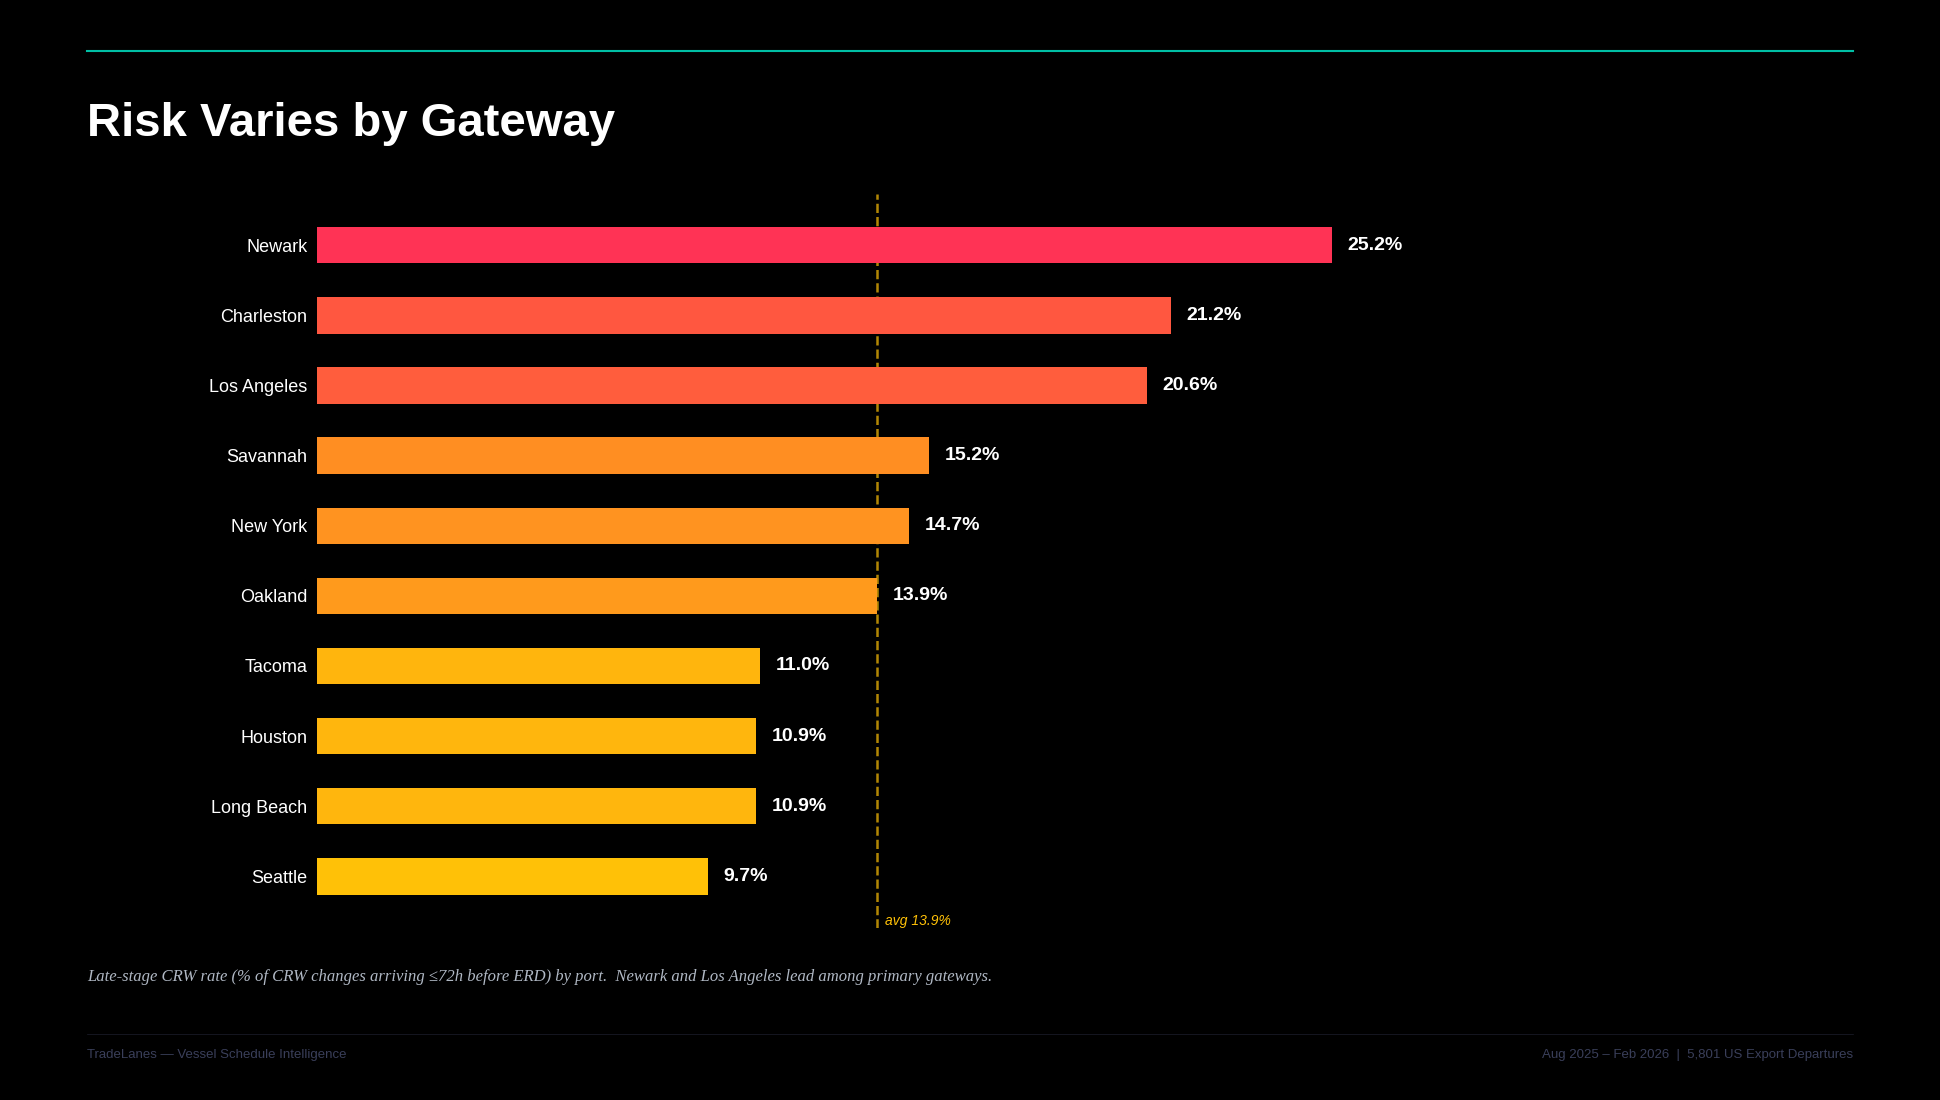
Not All Ports Behave the Same
Late-stage concentration varies significantly:
- Newark: 25.2%
- Los Angeles: 20.6%
- Savannah: 15.2%
- Houston: 10.9%
Charleston shows the highest confirmed collapse density (7.1%), but on small volume.
Savannah dominates volume, but not late-stage risk.
Houston shows consistent CRW impact, but earlier resolution.
Figure 5 - Late-Stage by Port
A single commitment rule across gateways is structurally incorrect.
Not All Carriers Behave the Same
Carrier patterns diverge materially:
- Hapag-Lloyd: 21.9% late-stage
- MSC: 15.5% late-stage, highest decision density
- Maersk: 11.2% late-stage, most front-loaded
The implication: Carrier selection changes when risk shows up. Not just how often.
Figure 6 - Carrier Late-Stage Comparison
The difference is not frequency. It is when the change arrives.

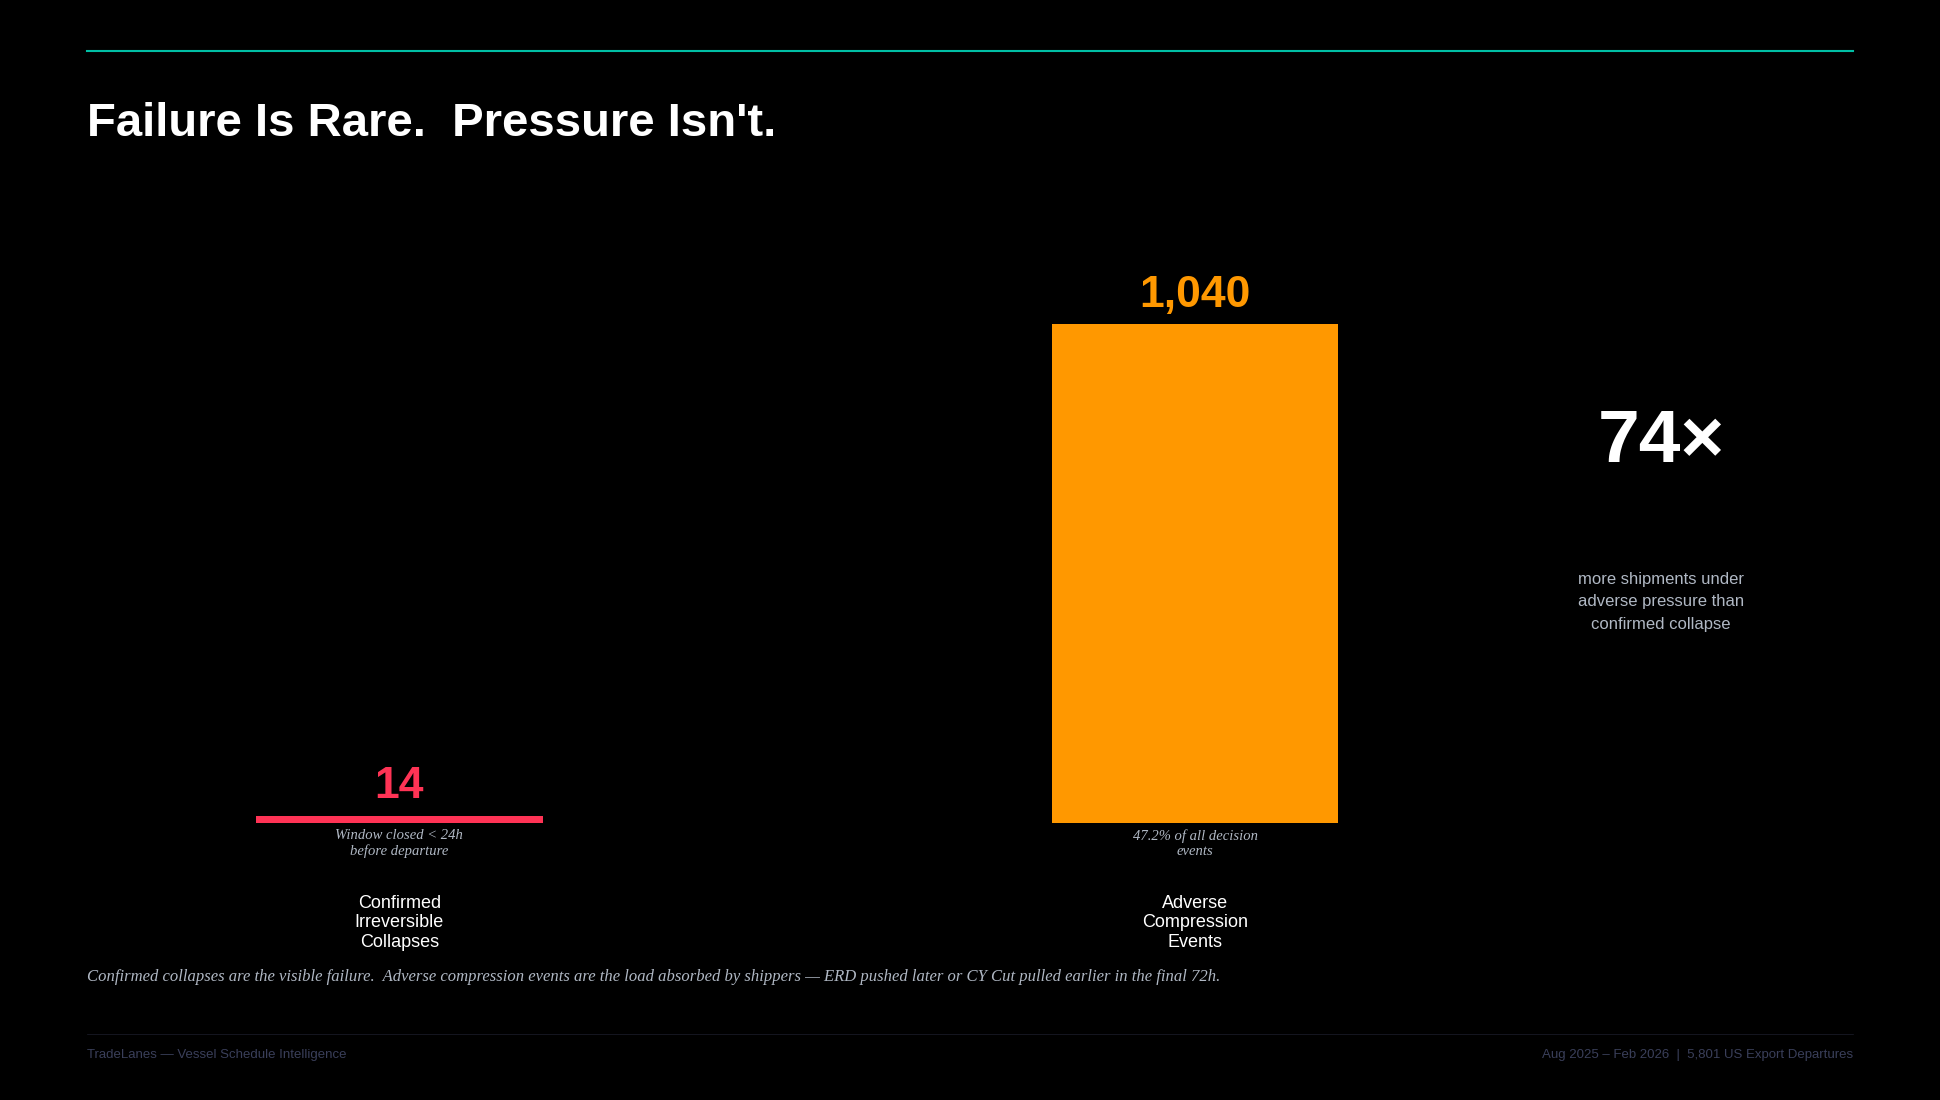
The Real Risk Is Not Collapse
Only 14 confirmed collapses occurred.
But that is not the real risk.
47.2% of decision events were adverse compressions.
That means:
- The window moved later
- The cutoff moved earlier
- Execution pressure increased
Most shipments did not fail.
They were absorbed.
Figure 7 - Decision vs Compression
The failure count is small. The pressure count is large.
The Inflection Point
The week of October 13, 2025:
- 13× increase in update volume
- Transition into peak conditions
From that point forward:
- The system does not stabilize
- It evolves
By late season:
- Changes arrive later
- Decisions compress faster
Figure 8 - Inflection Timeline
The system does not break. It changes behavior.
The Structural Reframe
The wrong question:
“Did the schedule change?”
The right question:
“When did the change arrive relative to my commitment?”
Because:
- Early changes are manageable
- Late-stage changes are decisive
Figure 9 - Commitment Boundary
After this boundary, options narrow quickly.
What This Means Operationally
The schedule system is not broken.
It is behaving exactly as the data suggests:
- Most updates are irrelevant
- A small number are decisive
- Those decisions arrive late
- And they are getting later
Monitoring does not fail because teams miss updates.
It fails because: It treats all updates equally.
The goal is not to see everything.
It is to identify:The small set of changes that arrive after planning has effectively ended.
You don’t need more visibility. You need better timing awareness.


Leave a Comment