Why this article exists (before we look at any charts)
In the System Baseline edition of The Reliability Illusion, we established a simple but critical shift:
Vessel schedule reliability doesn’t break at arrival.
It breaks inside the cargo receiving window.
That window - defined by the Earliest Return Date (ERD) and the CY Cutoff - is where export execution actually happens.
This edition applies the same framework to Maersk (MAEU) to understand how cargo receiving windows behave in practice - where they stay predictable, and where they don’t.
All terms used here are defined in the Reliability Series - Methodology Appendix:
https://www.tradelanes.co/blog/reliability-series-methodology-appendix
Data scope (Maersk sample)
This analysis is based on an observational system sample of executable export port-calls and is not a statistically randomized sample.
- Port-calls: 903
- Vessels: 215
- Ports: 11
- Carrier: MAEU (Maersk)
Filters applied:
- ERD and CY Cutoff both required
- Drift >40 days treated as data error and excluded
Section 1 - How often do Maersk receiving windows actually move?
A receiving window is considered moved if either ERD or CY Cutoff shifts by one calendar day or more.
Figure 1 - Receiving Window Stability (Maersk)
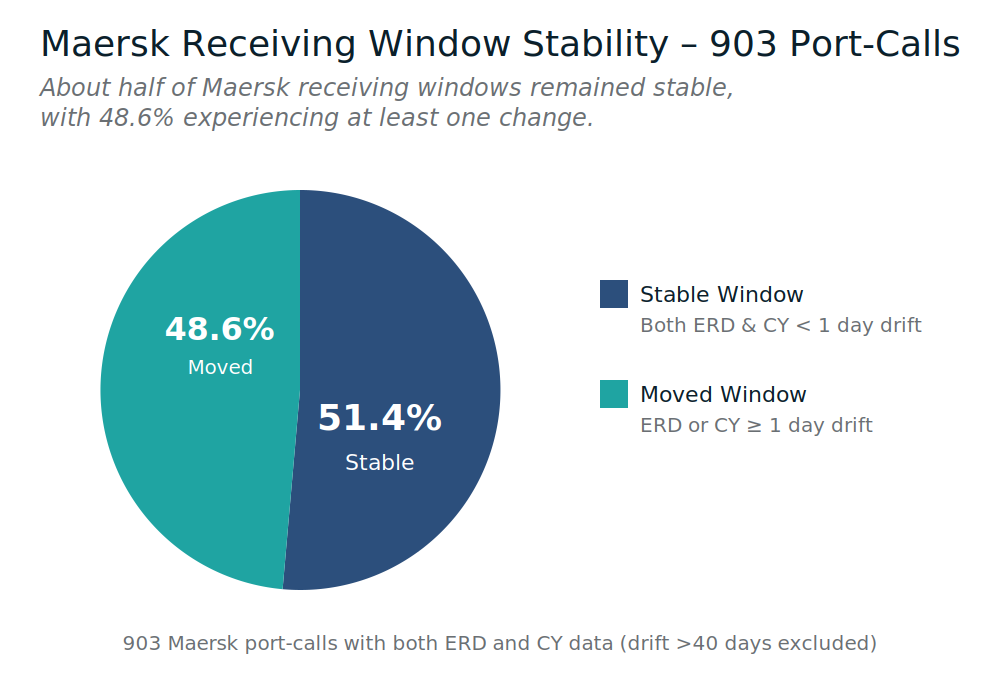
- Stable receiving windows: 51.38%
- Moved receiving windows: 48.62%
Plain English meaning:
For Maersk, receiving-window stability is just over half of port-calls. That stability is real - but nearly half of shipments still experience execution-relevant change, which explains why exporters can feel friction even when arrival performance looks strong.
Section 2 - Drift isn’t chaos; it has a shape
Drift measures how far ERDs or CY Cutoffs move between original and final values, expressed in calendar days.
Figure 2 - ERD Drift Distribution (Maersk)
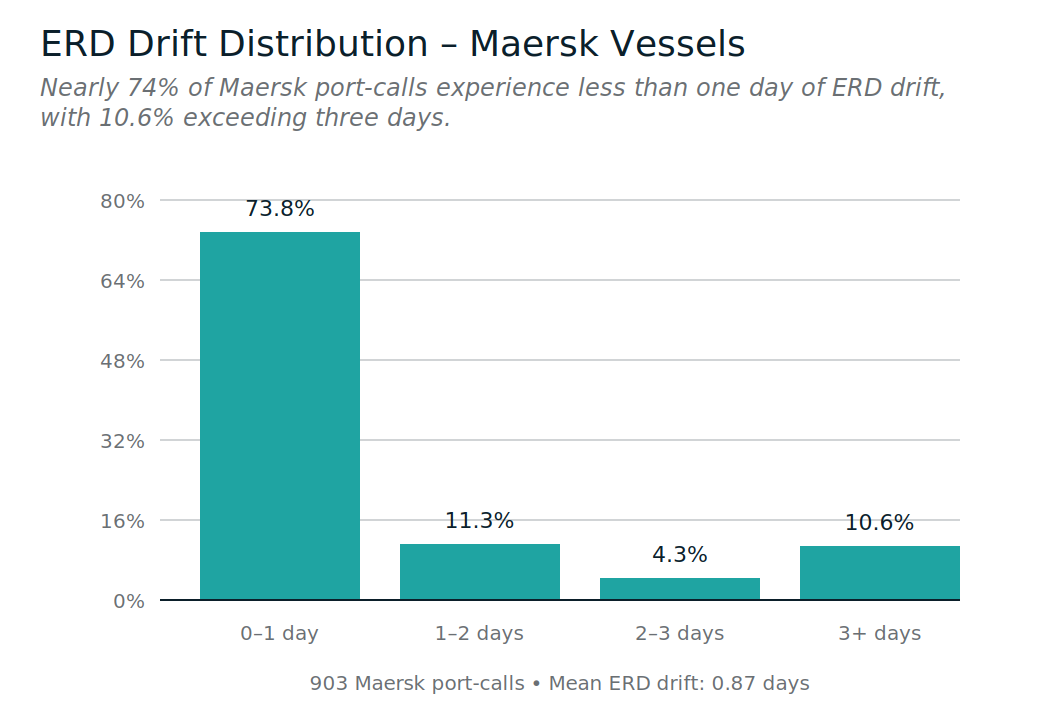
- 3+ day ERD drift: 10.63% of port-calls
Plain English meaning:
Most Maersk ERD changes are small. The tail is meaningfully smaller than some other carriers - but it still exists, and those tail events account for a disproportionate share of execution pain.
Static buffers are built for the middle of the curve.
Operational pain lives in the tail.
Section 3 - CY cutoffs are where risk concentrates for Maersk
Across the Maersk sample, CY Cutoff drift materially exceeds ERD drift.
Figure 3 - ERD vs CY Drift (Maersk)
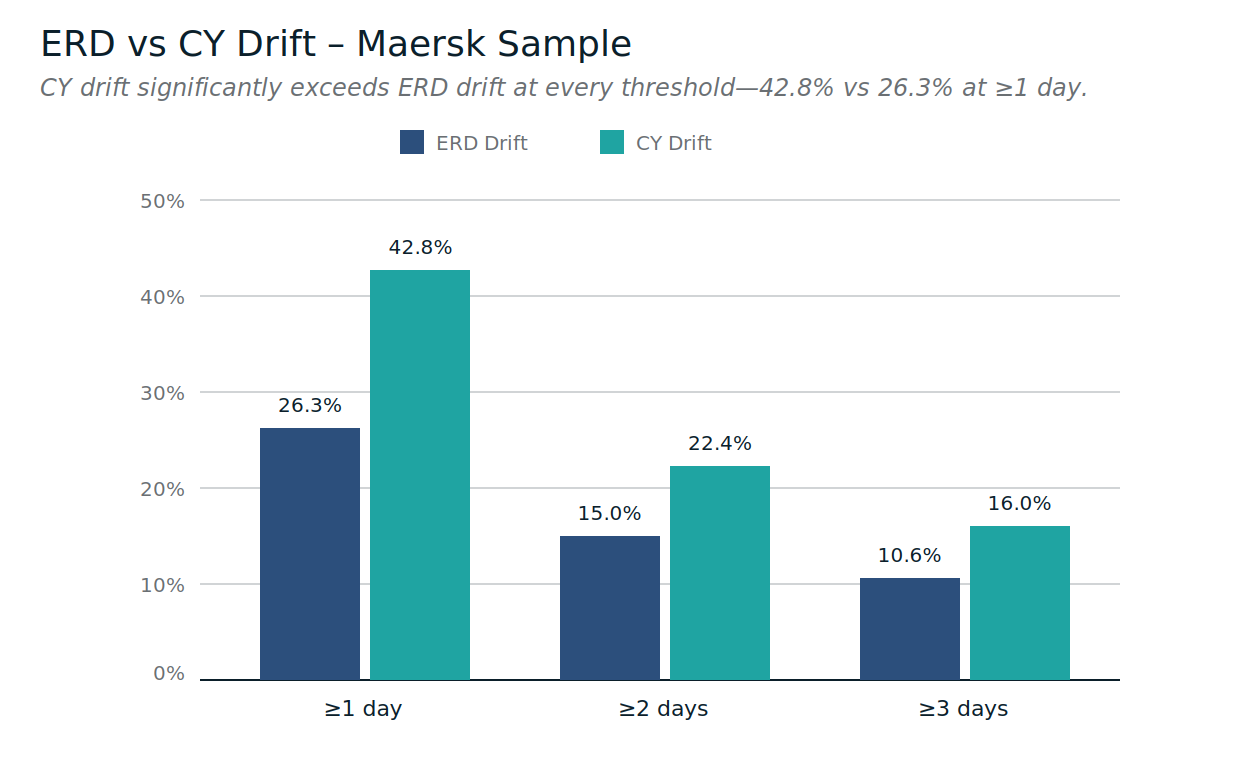
Average drift
- Mean ERD drift: 0.87 days
- Mean CY drift: 1.30 days
Threshold comparison
- ≥1 day drift: ERD 26.25% vs CY 42.75%
- ≥2 days drift: ERD 14.95% vs CY 22.37%
- ≥3 days drift: ERD 10.63% vs CY 15.95%
Plain English meaning:
This is the clearest Maersk signal: CY Cutoffs are the dominant execution constraint. ERDs are comparatively stable, but CY movement - especially at the 1-day threshold - is frequent enough to break plans late.
Section 4 - Timing matters more than averages
A late-stage change is defined as a change to ERD or CY Cutoff that occurs within the final 72 hours before the receiving window opens.
Figure 4 - Late-Stage Receiving Window Changes (Maersk)
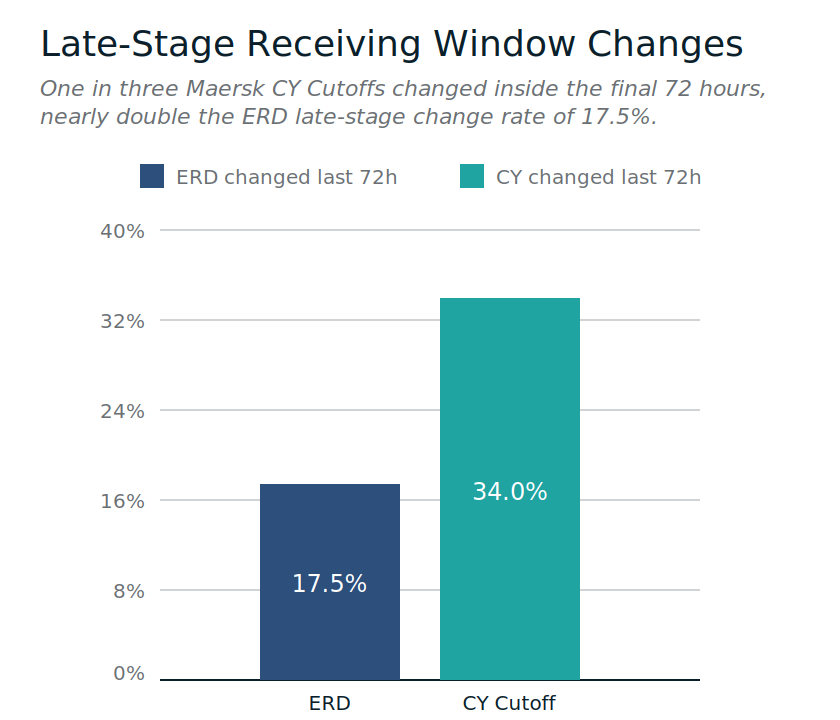
- ERD changed in last 72 hours: 17.5%
- CY Cutoff changed in last 72 hours: 34.0%
Plain English meaning:
About one-third of Maersk CY Cutoffs change inside the final 72 hours. Even with relatively strong average stability, this late timing is what creates disproportionate execution friction.
So far, we’ve looked at how windows move.
Next, we look at where.
Section 5 - Volatility is not evenly distributed across terminals (Maersk)
The Port Volatility Index (PVI) reflects how quickly static planning assumptions break at a port.
Figure 5 - Port-Level Drift (Maersk)
Below are the highest-volatility ports in the Maersk sample. Ports with smaller sample sizes should be interpreted cautiously.
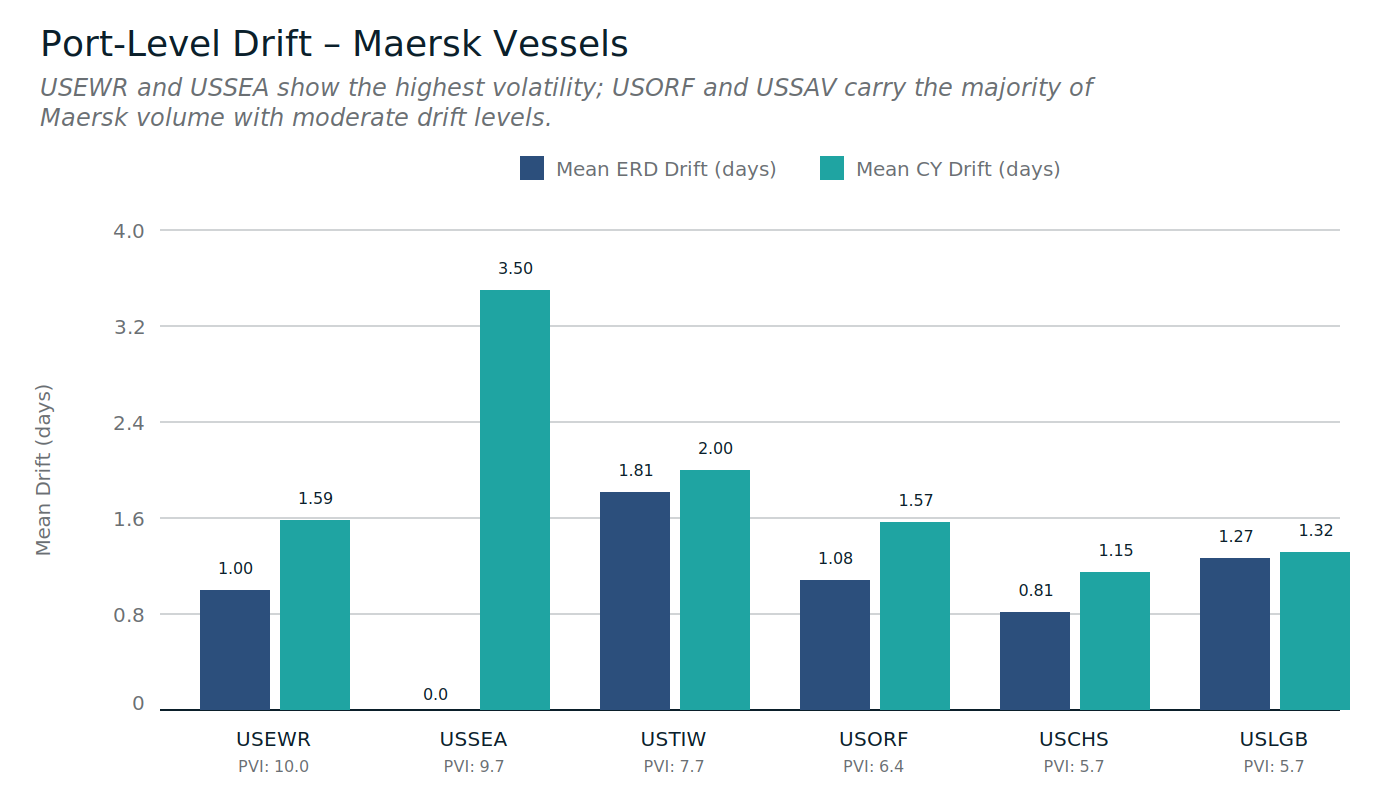
USEWR (PVI 10.0)
- Mean ERD drift: 1.00 days
- Mean CY drift: 1.59 days
- Stable window rate: 42.86%
- CY late-stage change: 38.10%
What this feels like:
Balanced ERD and CY movement, with meaningful late-stage CY change. Plans often feel workable early, then require rework close to cutoff.
USSEA (PVI 9.7)
- Mean ERD drift: 0.00 days
- Mean CY drift: 3.50 days
- Stable window rate: 50.00%
- CY late-stage change: 50.00%
What this feels like:
A CY-dominant volatility profile. ERDs remain stable, but cutoffs move far and late, breaking execution after plans feel locked. This is volatility shifting to the end of the window rather than the start.
USTIW (PVI 7.7)
- Mean ERD drift: 1.81 days
- Mean CY drift: 2.00 days
- Stable window rate: 38.46%
- CY late-stage change: 30.77%
What this feels like:
Both ends of the receiving window move meaningfully. Exporters need buffer range, not precision, and should expect re-validation throughout the planning cycle.
USORF (PVI 6.4)
- Mean ERD drift: 1.08 days
- Mean CY drift: 1.57 days
- Stable window rate: 46.15%
- CY late-stage change: 30.77%
What this feels like:
Moderate drift with execution risk weighted toward CY timing. Reliability stress shows up later rather than earlier.
USCHS / USLGB (PVI ~5.7)
USCHSX
- Mean ERD drift: 0.81 days
- Mean CY drift: 1.15 days
- Stable window rate: 53.85%
- CY late-stage change: 30.77%
USLGB
- Mean ERD drift: 1.27 days
- Mean CY drift: 1.32 days
- Stable window rate: 50.00%
- CY late-stage change: 28.57%
What this feels like:
More forgiving environments overall - but still not immune to late-stage CY movement, which remains the primary execution risk even when average drift looks manageable.
Section 5 takeaway (implicit, not editorialized)
For Maersk, volatility is less about large early shifts and more about late CY timing, concentrated in specific ports. ERD stability improvements are real - but execution risk has migrated to the cutoff layer, which is why exporters can still experience friction despite strong arrival and ERD metrics.
Section 6 - Severity still exists, even when averages look manageable
Figure 6 - Top 10 Highest-Severity Maersk Events
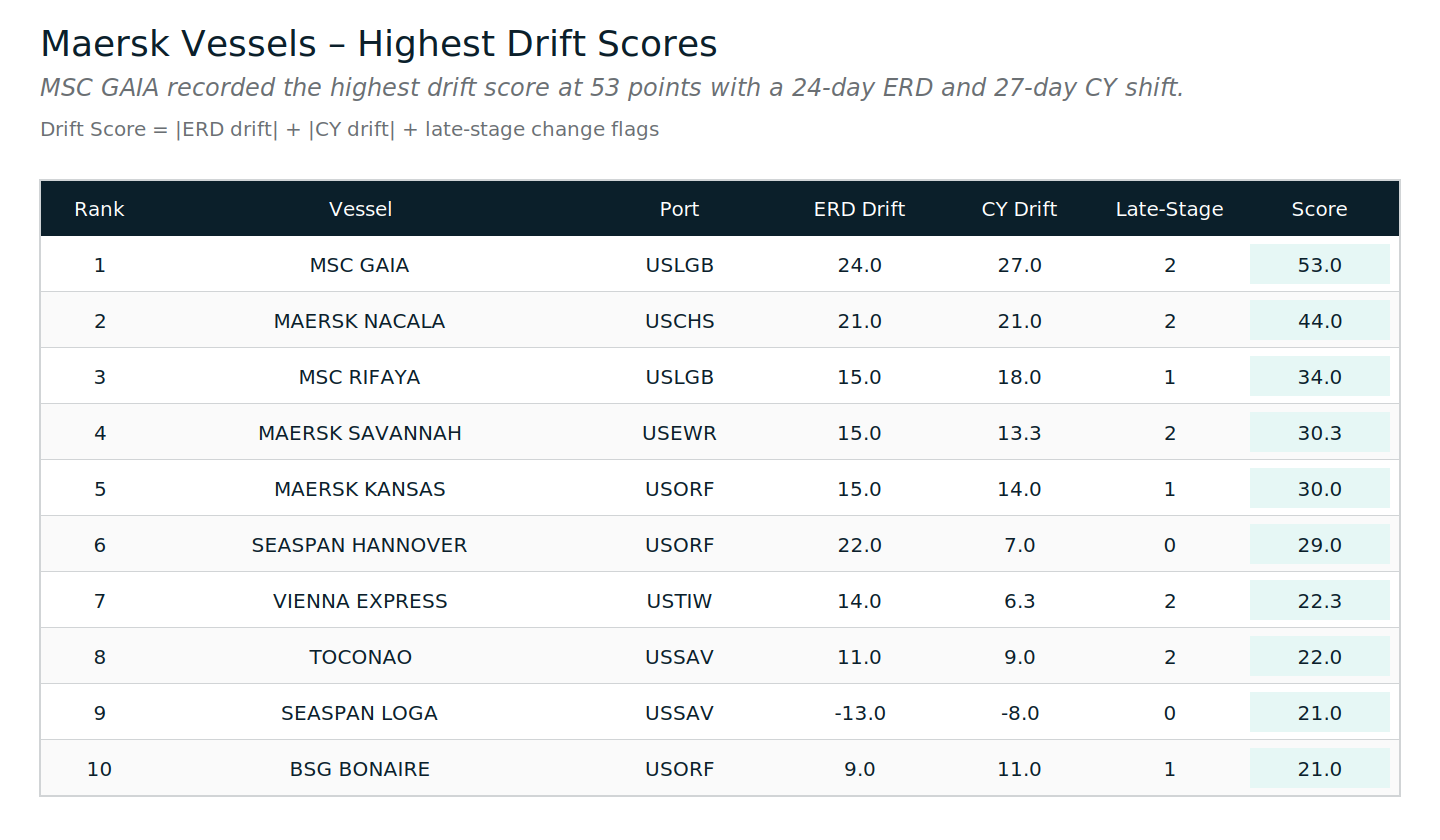
Plain English meaning:
These are stress tests, not typical shipments. They show that even in a comparatively stable carrier profile, large and late changes still occur - and static buffers fail when they do.
Section 7 - The KPI that matters for Maersk
Figure 7 - Receiving Window Movement Rate (Maersk)
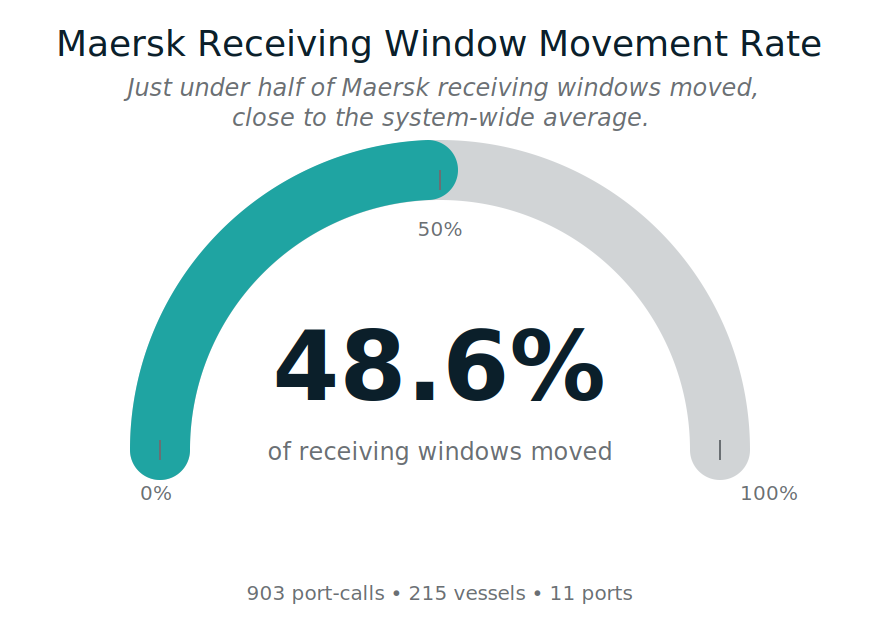
- Moved receiving windows: 48.62%
- Stable receiving windows: 51.38%
- Scope: 903 port-calls • 215 vessels • 11 ports
Plain English meaning:
For Maersk, stability is the majority state - but movement is still frequent enough that predictability must be actively managed, especially around CY Cutoffs.
Section 8 - Why static buffers fail (and why this repeats)
Figure 8 - Static Buffer vs Dynamic Time Buffer (DTB)
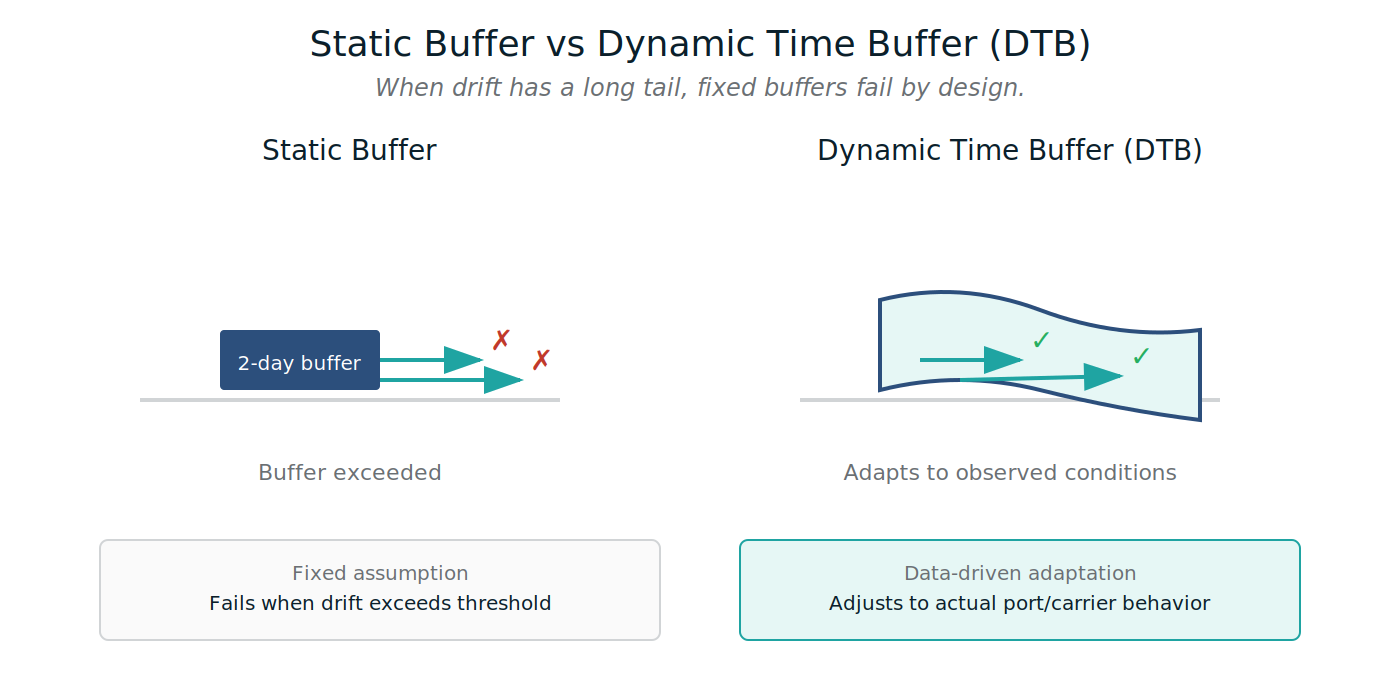
Plain English meaning:
When late-stage CY movement is common, fixed buffers are routinely exceeded. Planning must adapt to observed receiving-window behavior, not assumed arrival reliability.
Before we move to the next carrier
A vessel can be “on time” and still break export execution if the receiving window shifts underneath it.
This Maersk edition shows:
- relatively strong ERD stability,
- CY Cutoff timing as the primary execution risk, and
- reliability that looks good in aggregate but still breaks locally by port and timing.
Methodology and definitions:
Reliability Series - Methodology Appendix
https://www.tradelanes.co/blog/reliability-series-methodology-appendix
Next in the Carrier Reliability Series
Hapag-Lloyd publishing soon.


Leave a Comment