Why this article exists (before we look at any charts)
In the System Baseline edition of The Reliability Illusion, we established a simple but critical shift:
Vessel schedule reliability doesn’t break at arrival.
It breaks inside the cargo receiving window.
That window - defined by the Earliest Return Date (ERD) and the CY Cutoff - is where export execution actually happens.
This edition applies the same framework to Evergreen (EGLV), a carrier often perceived as steady, to understand how receiving windows behave once you look beyond arrival performance and into execution reality.
All terms used here are defined in the Reliability Series - Methodology Appendix:
https://www.tradelanes.co/blog/reliability-series-methodology-appendix
Data scope (Evergreen sample)
This analysis is based on an observational system sample of executable export port-calls and is not a statistically randomized sample.
- Port-calls: 163
- Vessels: 58
- Ports: 7
- Carrier: Evergreen (EGLV)
Filters applied:
- ERD and CY Cutoff both required
- Drift >40 days treated as data error and excluded
Section 1 - How often do Evergreen receiving windows actually move?
A receiving window is considered moved if either ERD or CY Cutoff shifts by one calendar day or more from its originally published value.
Figure 1 - Receiving Window Stability (Evergreen)
- Stable receiving windows: 50.92%
- Moved receiving windows: 49.08%
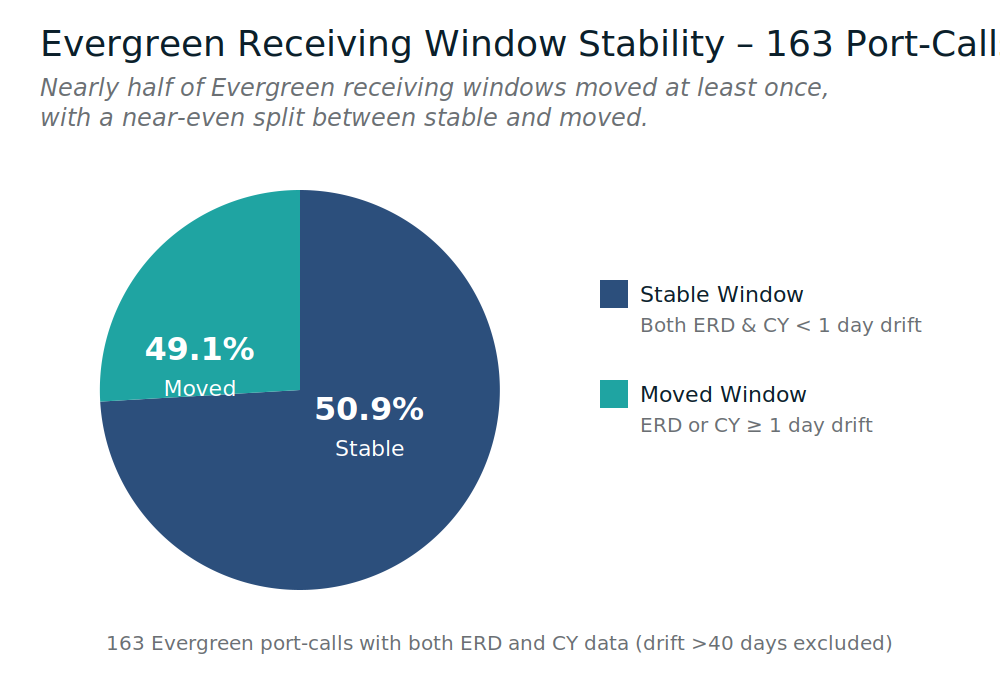
Plain-English meaning:
Evergreen receiving windows are almost evenly split between stable and moved. Even with a reputation for steadiness, nearly half of port-calls still experience execution-relevant change.
Section 2 - Drift isn’t chaos; it has a shape
Drift measures how far ERDs or CY Cutoffs move between original and final values, expressed in calendar days.
Figure 2 - ERD Drift Distribution (Evergreen)
- 0-1 day: 55.83%
- 1-2 days: 12.88%
- 2-3 days: 4.29%
- 3+ days: 26.99%
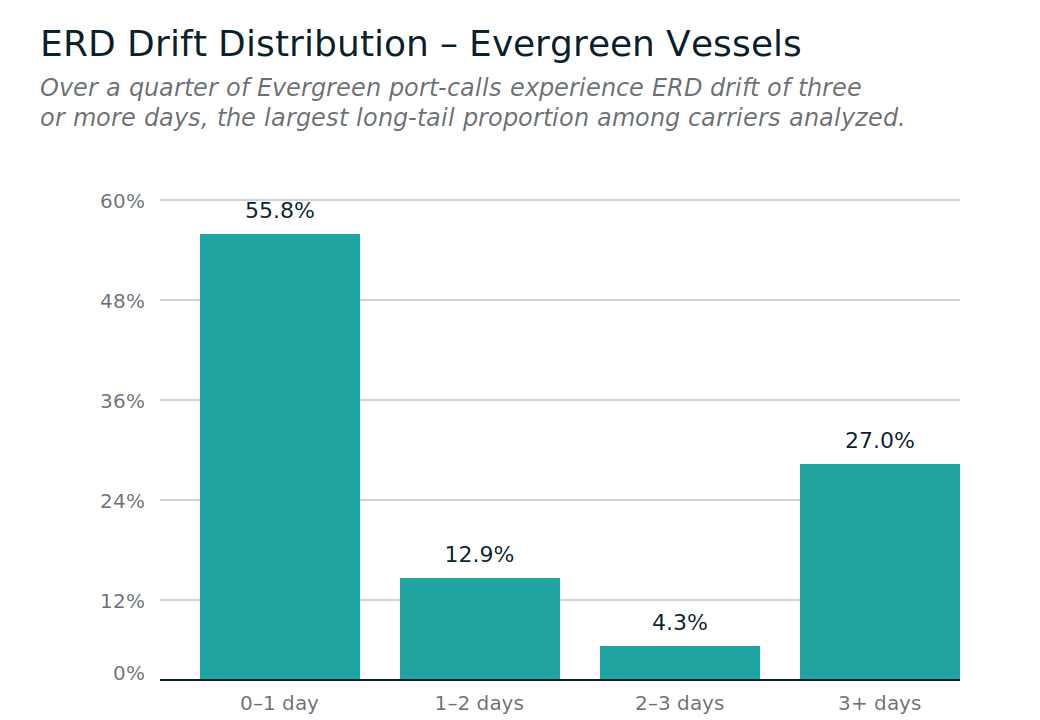
Plain-English meaning:
Most Evergreen ERD changes are small - but more than one in four port-calls experience 3+ days of ERD drift.
Static buffers are built for the middle of the curve.
Operational pain lives in the tail.
Section 3 - CY cutoffs are where risk concentrates for Evergreen
Across the Evergreen sample, CY Cutoff drift slightly exceeds ERD drift.
Figure 3 - ERD vs CY Drift (Evergreen)
Average drift
- Mean ERD drift: 1.52 days
- Mean CY drift: 1.53 days
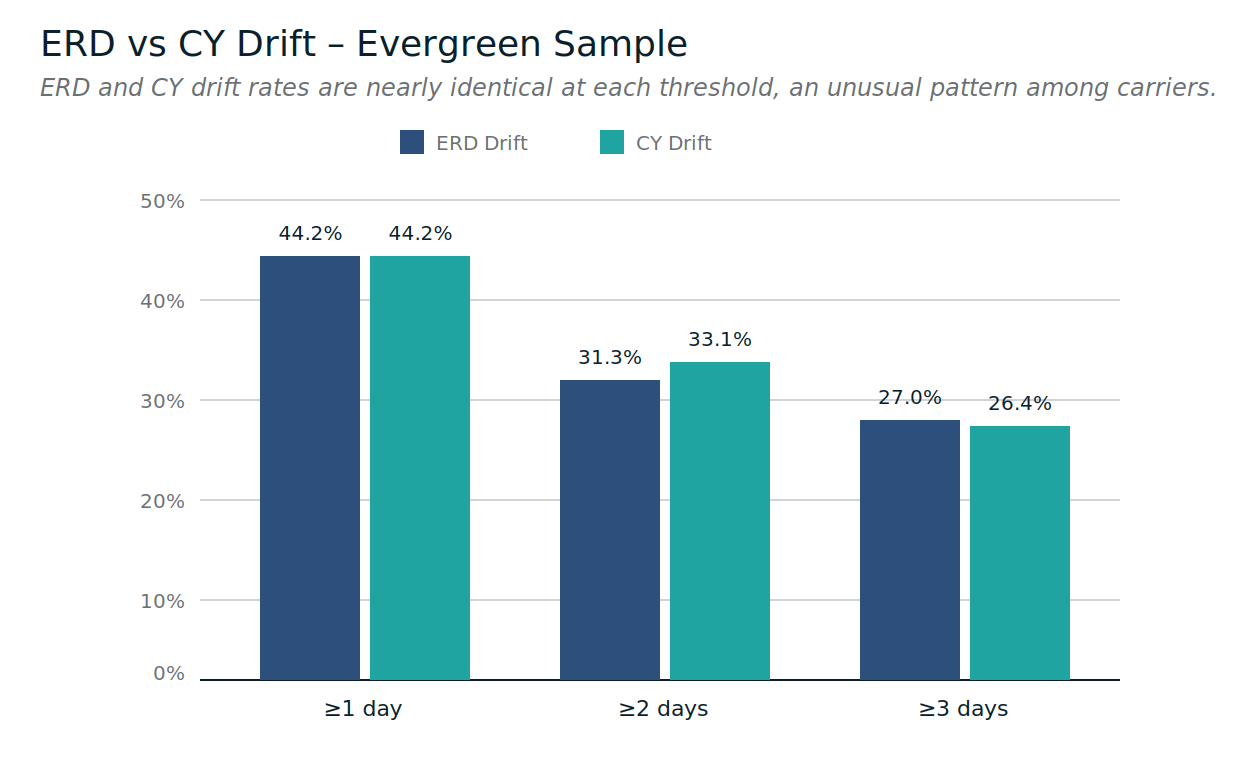
Threshold comparison
- ≥1 day drift: ERD 44.17% vs CY 44.17%
- ≥2 days drift: ERD 31.29% vs CY 33.13%
- ≥3 days drift: ERD 26.99% vs CY 26.38%
Plain-English meaning:
Evergreen shows balanced ERD and CY volatility, but that balance still produces frequent execution breaks. Stability is not absence of movement - it’s whether the plan still holds.
Section 4 - Timing matters more than averages
A late-stage change occurs within the final 72 hours before the receiving window opens.
Figure 4 - Late-Stage Receiving Window Changes (Evergreen)
- ERD changed in last 72 hours: 23.31%
- CY Cutoff changed in last 72 hours: 20.25%
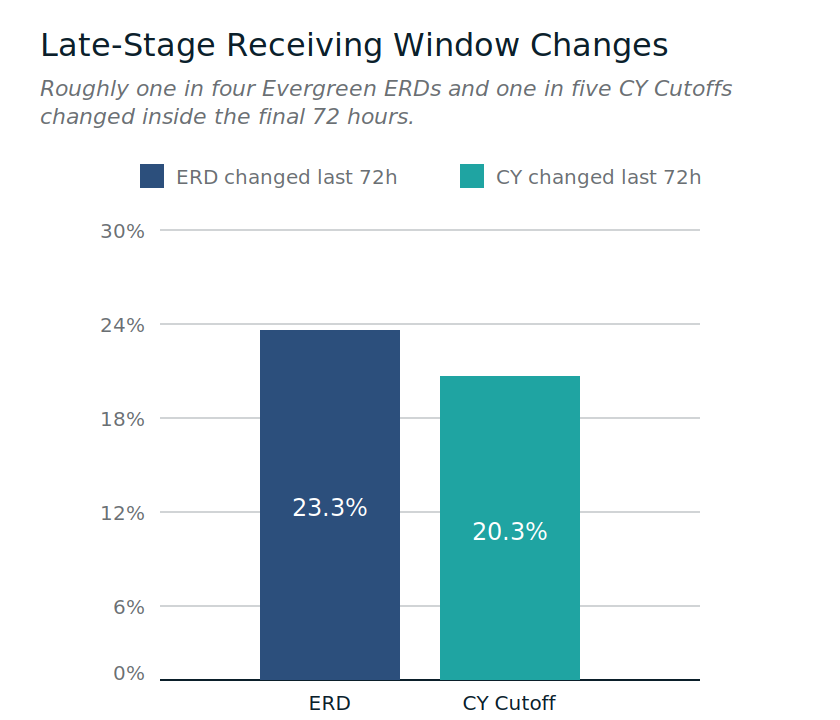
Plain-English meaning:
Roughly one in five Evergreen CY Cutoffs change inside the final three days. That’s enough late movement to disrupt otherwise workable plans.
So far, we’ve looked at how windows move.
Next, we look at where.
Section 5 - Volatility is not evenly distributed across terminals (Evergreen)
The Port Volatility Index (PVI) reflects how quickly static planning assumptions break at a port.
Figure 5 - Port-Level Drift (Evergreen)
Below are Evergreen’s most volatile ports in this sample. Ports with very small sample sizes should be interpreted cautiously.
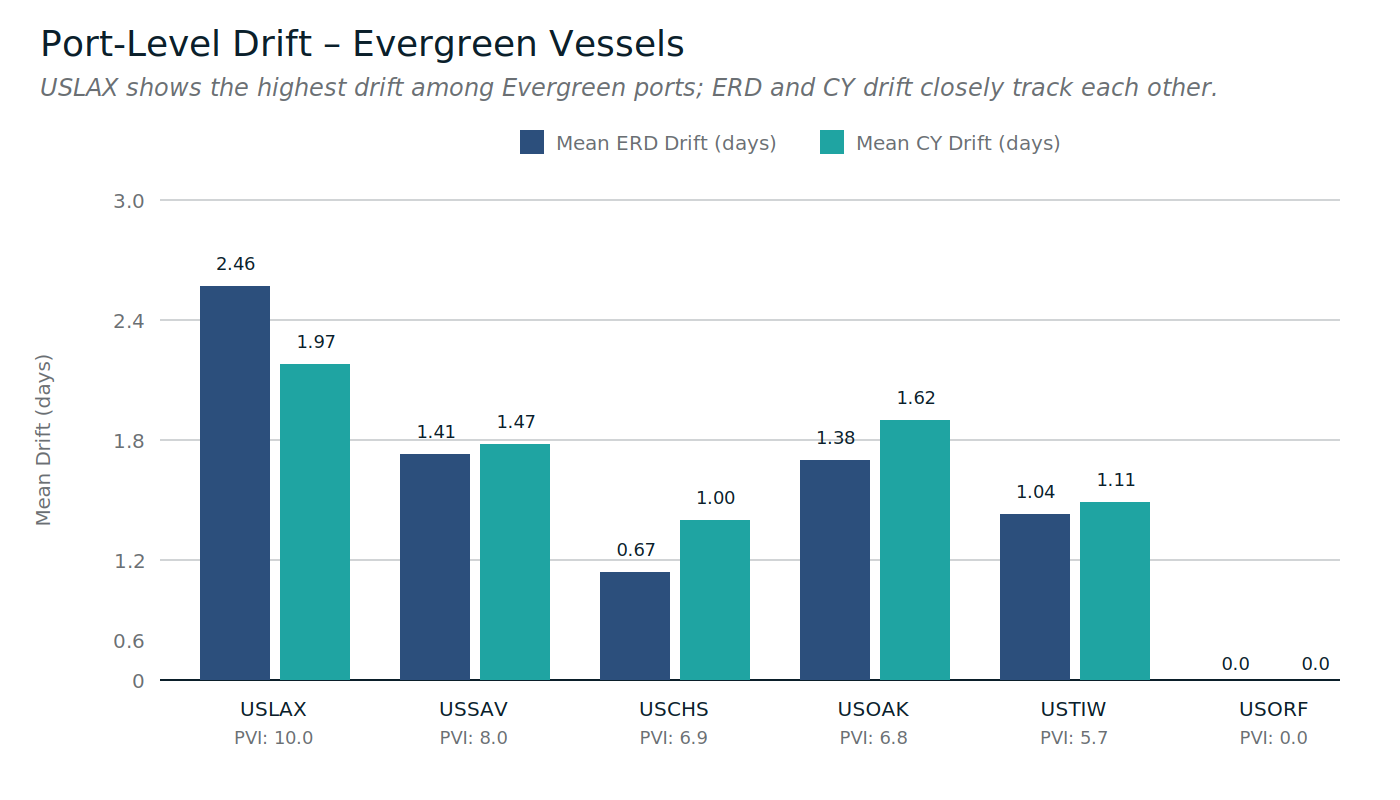
USLAX (PVI 10.0, n=35)
- Mean ERD drift: 2.46 days
- Mean CY drift: 1.97 days
- Stable window rate: 48.57%
- CY late-stage change: 20.00%
What this feels like:
A high-movement environment. Plans often need re-work, even when arrival performance appears solid.
USSAV (PVI 8.0, n=34)
- Mean ERD drift: 1.41 days
- Mean CY drift: 1.47 days
- Stable window rate: 41.18%
- ERD late-stage change: 38.24%
What this feels like:
Movement is frequent and often lands late. Execution risk compounds close to cutoff.
USCHS (PVI 6.9, n=6)
- Mean ERD drift: 0.67 days
- Mean CY drift: 1.00 days
- CY late-stage change: 66.67%
What this feels like:
Small sample, but late-stage CY movement dominates. Looks stable until it isn’t.
USOAK (PVI 6.8, n=58)
- Mean ERD drift: 1.38 days
- Mean CY drift: 1.62 days
- Stable window rate: 51.72%
What this feels like:
Moderate drift with fewer late shocks. More forgiving, but not risk-free.
Section 6 - Severity still exists, even when averages look manageable
Figure 6 - Top 10 Highest-Severity Evergreen Events
Top examples:
- EVER SHINE (USTIW): ERD 7d, CY 8d, late-stage 2, score 17
- EVER MAX (USLAX): ERD 10d, CY 7d, late-stage 0, score 17
- EVER FULL (USSAV): ERD 7d, CY 7d, late-stage 2, score 16
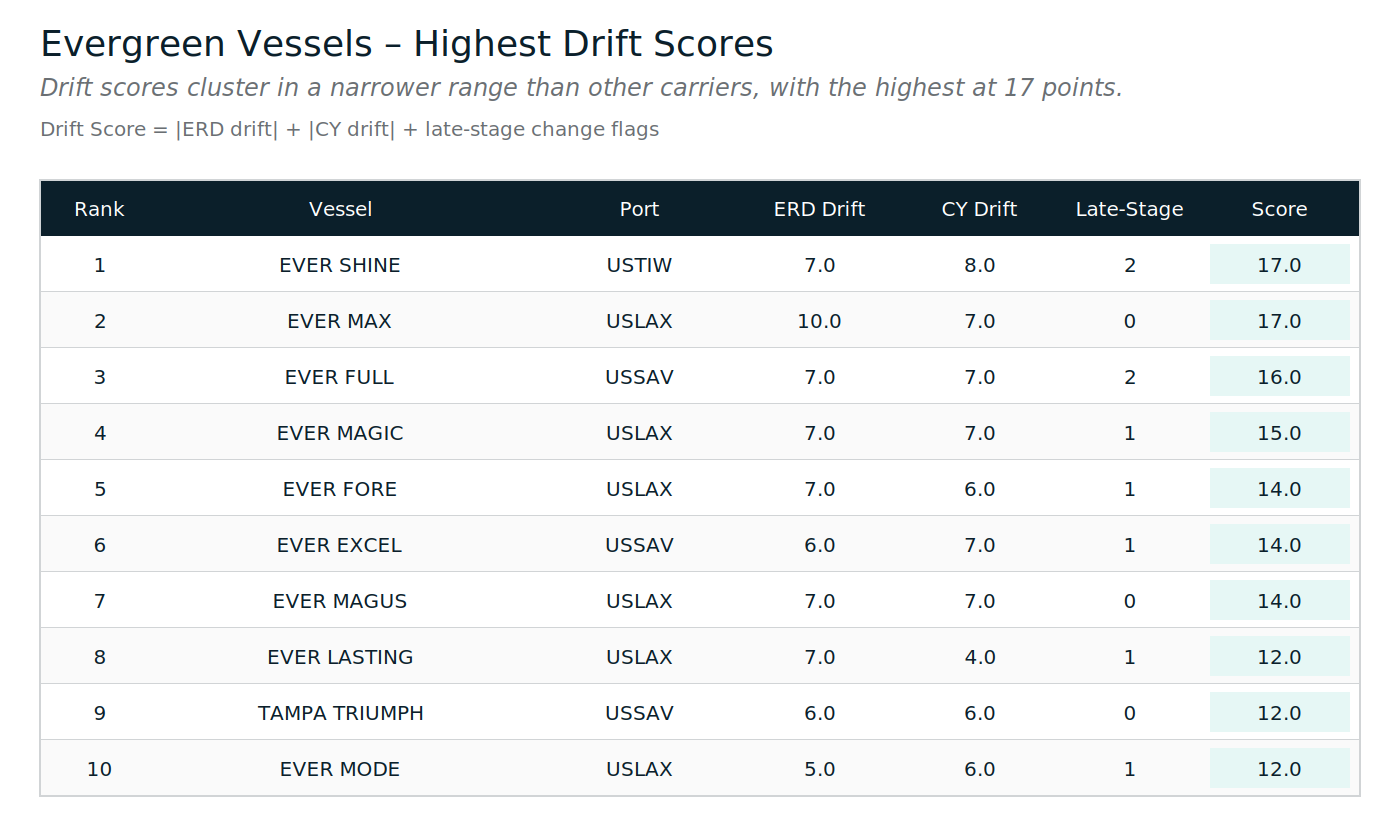
Plain-English meaning:
These are stress tests, not typical shipments. They show how quickly drift can stack when multiple changes coincide.
Static buffers fail in these scenarios by design.
Section 7 - The KPI that matters for Evergreen
Figure 7 - Receiving Window Movement Rate (Evergreen)
- Moved receiving windows: 49.08%
- Stable receiving windows: 50.92%
- Scope: 163 port-calls • 58 vessels • 7 ports
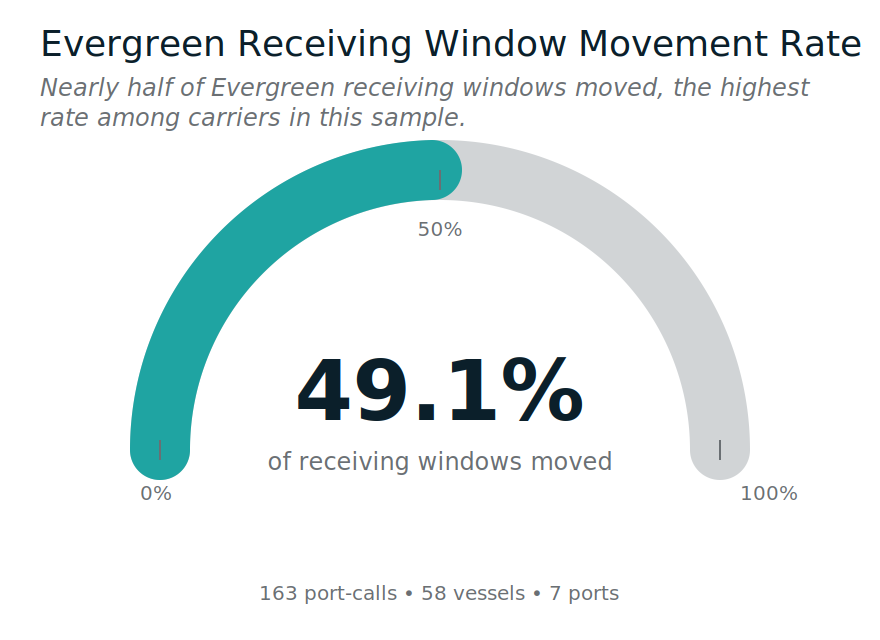
Plain-English meaning:
For Evergreen exports, predictability must be actively managed. Arrival performance alone does not prevent routine execution breaks.
Section 8 - Why static buffers fail (and why this repeats)
Figure 8 - Static Buffer vs Dynamic Time Buffer (DTB)
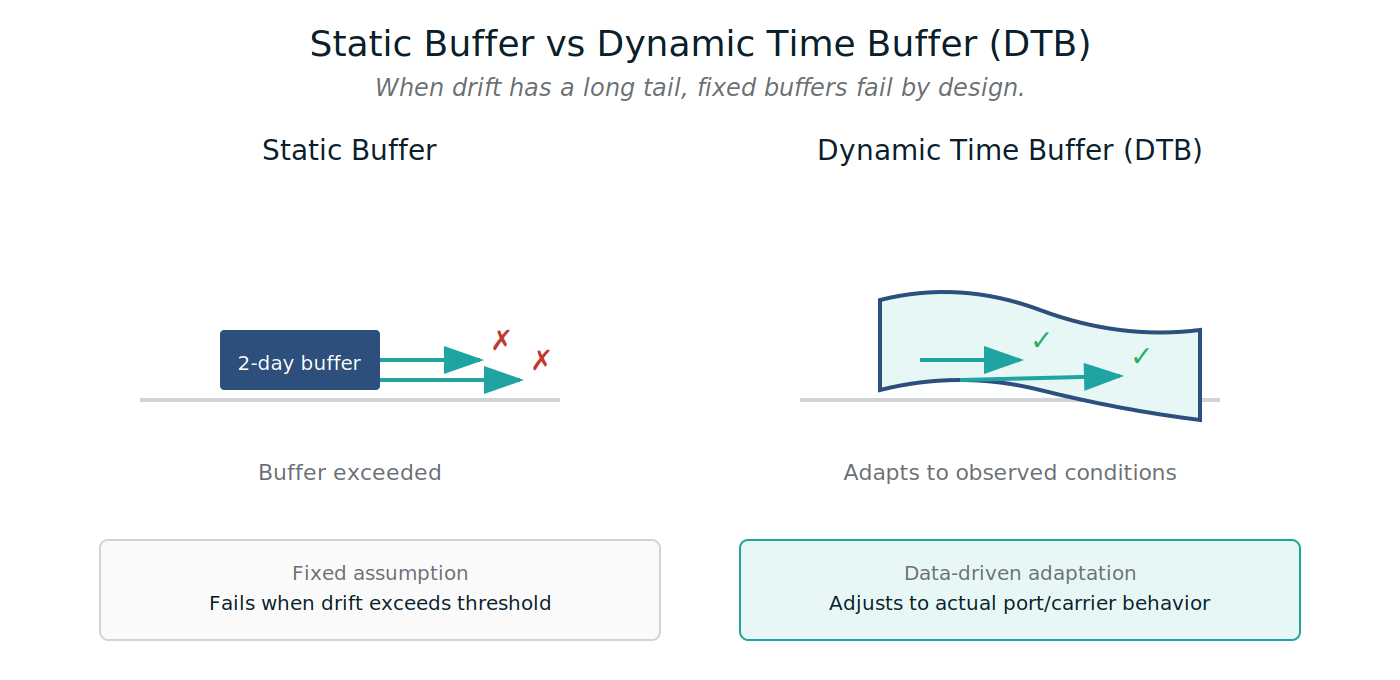
Plain-English meaning:
When drift has a long tail and late-stage changes are common, fixed buffers are routinely exceeded. Planning must adapt to observed behavior, not assumptions.
Before we move to the next carrier
A vessel can be “on time” and still break export execution if the receiving window shifts underneath it.
This Evergreen edition shows:
- stability is roughly a coin flip,
- ERD and CY volatility are balanced but meaningful, and
- execution risk concentrates by port, not evenly across the network.
Next in the Carrier Reliability Series:
ZIM - publishing soon.


Leave a Comment