Why this article exists (before we look at any charts)
In the System Baseline edition of The Ocean Carrier Reliability Illusion, we established a simple but critical shift:
Vessel schedule reliability doesn’t break at arrival.
It breaks inside the cargo receiving window.
That window - defined by the Earliest Return Date (ERD) and CY Cutoff - is where export execution actually happens.
This edition applies the same framework to CMA CGM (CMDU) to understand how receiving windows behave in practice once you stop measuring reliability as an arrival event and start measuring it as a receiving-window behavior.
All terms used here - including ERD, CY Cutoff, receiving window, drift, and late-stage change - are defined in the Reliability Series - Methodology Appendix:
https://www.tradelanes.co/blog/reliability-series-methodology-appendix
Data scope (CMA CGM sample)
This analysis is based on an observational system sample of executable export port-calls and is not a statistically randomized sample.
- Port-calls: 1,105
- Vessels: 171
- Ports: 9
- Carrier: CMDU (CMA CGM)
Filters applied:
- ERD and CY Cutoff both required
- Drift greater than 40 days treated as data error and excluded
Section 1 - How often do CMA CGM receiving windows actually move?
A receiving window is considered moved if either ERD or CY Cutoff shifts by one calendar day or more from its originally published value.
Figure 1 - Receiving Window Stability (CMA CGM)
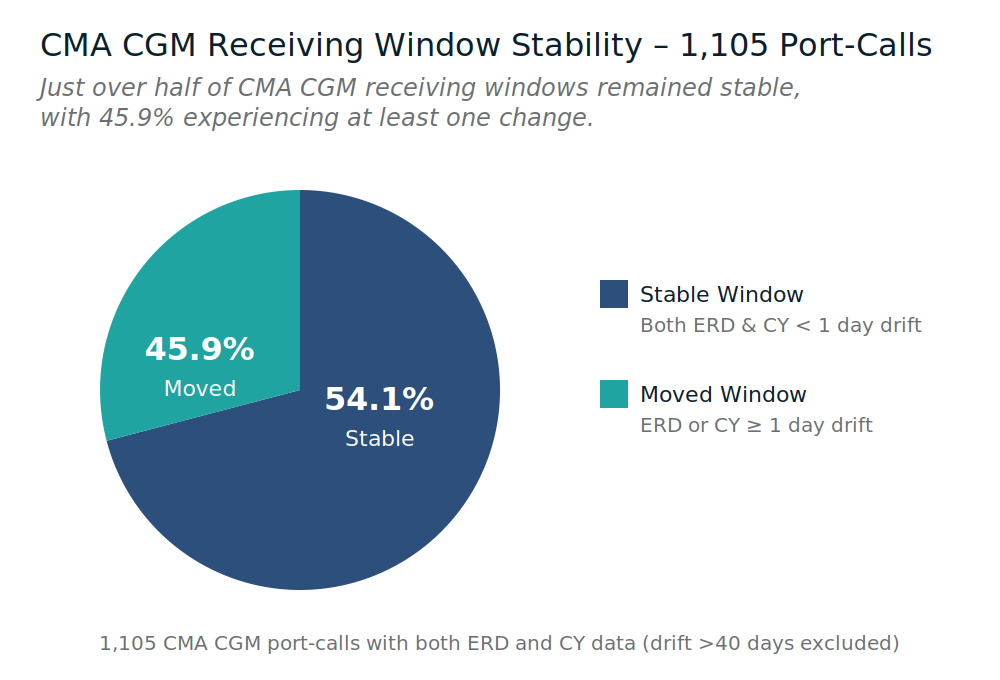
- Stable receiving windows: 54.12%
- Moved receiving windows: 45.88%
Plain English meaning:
CMA CGM receiving windows are stable in a majority of port-calls - but nearly 46% still move. That level of movement is enough to create routine execution breaks even if vessel arrival performance looks healthy in traditional reporting.
Section 2 - Drift isn’t chaos; it has a shape
Drift measures how far an ERD or CY Cutoff moves between original and final values, expressed in calendar days.
Figure 2 - ERD Drift Distribution (CMA CGM)
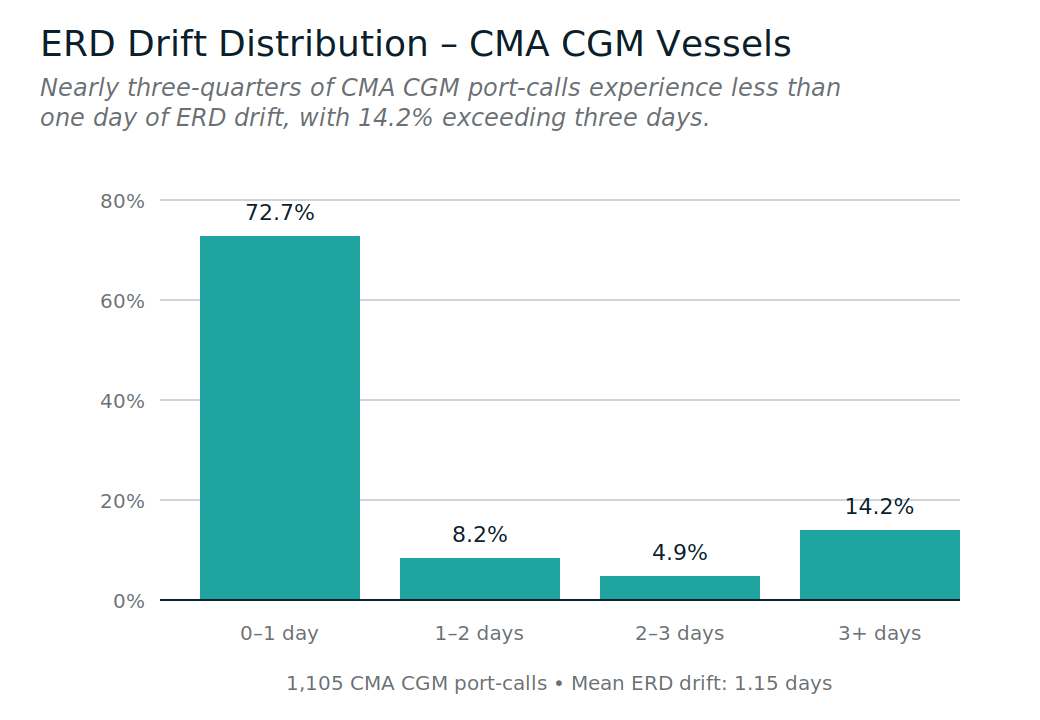
ERD drift distribution:
- 0-1 day: 72.67%
- 1-2 days: 8.24%
- 2-3 days: 4.89%
- 3+ days: 14.21%
Plain English meaning:
Most CMA CGM ERD movement is small. But the tail is real - about 1 in 7 port-calls show 3+ days of ERD drift.
Static buffers are built for the middle of the curve. Operational pain lives in the tail.
Section 3 - CY cutoffs are where risk concentrates for CMA CGM
Across the CMA CGM sample, CY Cutoff drift exceeds ERD drift.
Figure 3 - ERD vs CY Drift (CMA CGM)
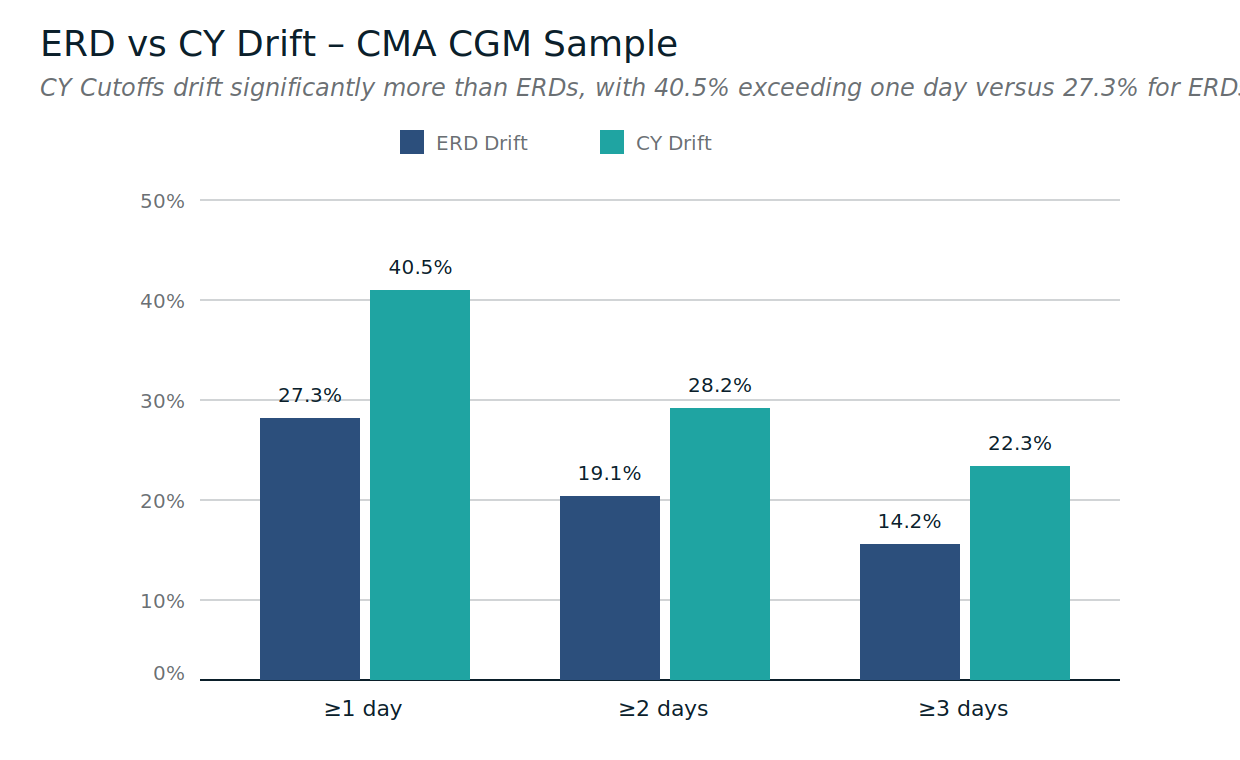
Average drift:
- Mean ERD drift: 1.15 days
- Mean CY drift: 1.64 days
Threshold comparison:
- ≥1 day drift: ERD 27.33% vs CY 40.54%
- ≥2 days drift: ERD 19.10% vs CY 28.24%
- ≥3 days drift: ERD 14.21% vs CY 22.26%
Plain English meaning:
The same system pattern holds, but the gap is especially clear here - CY Cutoffs drift materially more often than ERDs. Exporters can feel “safe” early because ERDs look manageable, then get exposed when CY Cutoffs move underneath the plan.
Section 4 - Timing matters more than averages
A late-stage change is defined as a change to ERD or CY Cutoff that occurs within the final 72 hours before the receiving window opens.
Figure 4 - Late-Stage Receiving Window Changes (CMA CGM)
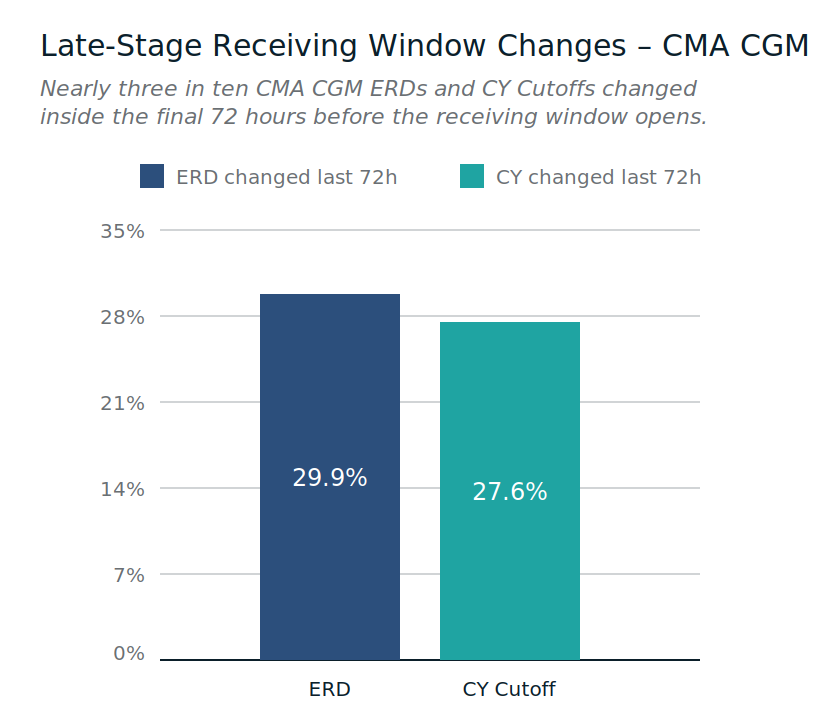
- ERD changed in last 72 hours: 29.86%
- CY Cutoff changed in last 72 hours: 27.60%
Plain English meaning:
Late-stage change is common in this CMA CGM sample - roughly 3 in 10 ERDs and nearly 3 in 10 CY Cutoffs change inside the final 72 hours. That is the dispatch lock problem: plans feel stable until the moment options are limited.
So far, we’ve looked at how windows move. Next, we look at where.
Section 5 - Volatility is not evenly distributed across terminals (CMA CGM)
The Port Volatility Index (PVI) combines:
- how far ERDs move,
- how far CY Cutoffs move, and
- how often changes happen late,
into a normalized score (0-10) representing how quickly static planning assumptions break at a port.
A higher PVI doesn’t mean a port is “bad.” It means static assumptions break faster there.
Figure 5 - Port-Level Drift (CMA CGM)
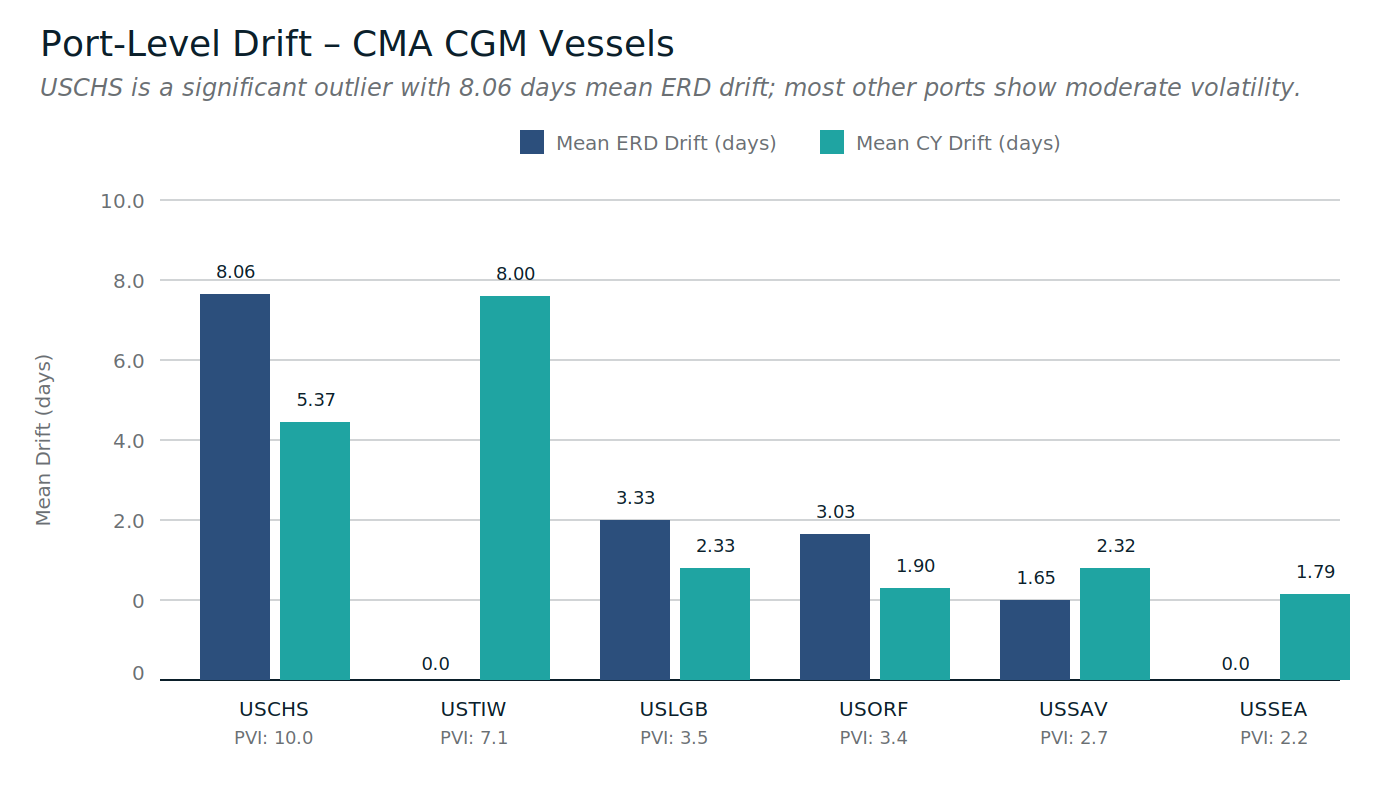
Below is a Plain English interpretation of CMA CGM’s highest-volatility ports in this sample. Ports with very small sample sizes should be interpreted cautiously.
USCHS (PVI 10.0, n=18 port-calls)
- Mean ERD drift: 8.06 days
- Mean CY drift: 5.37 days
- Stable window rate: 66.67%
- CY late-stage change: 72.22%
What this feels like:
This is a high-severity, late-stage environment in a limited sample. When it moves, it can move far - and CY changes often land late.
USORF (PVI 3.4, n=115)
- Mean ERD drift: 3.03 days
- Mean CY drift: 1.90 days
- Stable window rate: 22.61%
- CY late-stage change: 36.52%
What this feels like:
Frequent re-validation. ERD drift is meaningful, and late-stage CY movement is common enough to create last-minute rework.
USSAV (PVI 2.7, n=361)
- Mean ERD drift: 1.65 days
- Mean CY drift: 2.32 days
- Stable window rate: 37.95%
- CY late-stage change: 29.64%
What this feels like:
A port where CY volatility dominates. Plans can look workable early, but CY Cutoffs still shift often enough to force adjustments.
USNYC (PVI 2.0, n=294)
- Mean ERD drift: 0.40 days
- Mean CY drift: 1.62 days
- Stable window rate: 51.70%
- ERD late-stage change: 55.78%
What this feels like:
Low average ERD drift but meaningful late-stage behavior. The plan can feel stable until close-in updates appear.
USLAX (PVI 0.0, n=244)
- Mean ERD drift: 0.19 days
- Mean CY drift: 0.31 days
- Stable window rate: 93.85%
- CY late-stage change: 12.70%
What this feels like:
A more forgiving environment in this sample. It does not eliminate risk, but it reduces how often a plan must be rebuilt.
Section 6 - Severity still exists, even when averages look manageable
Figure 6 - Top 10 Highest-Severity Events in the CMA CGM Sample
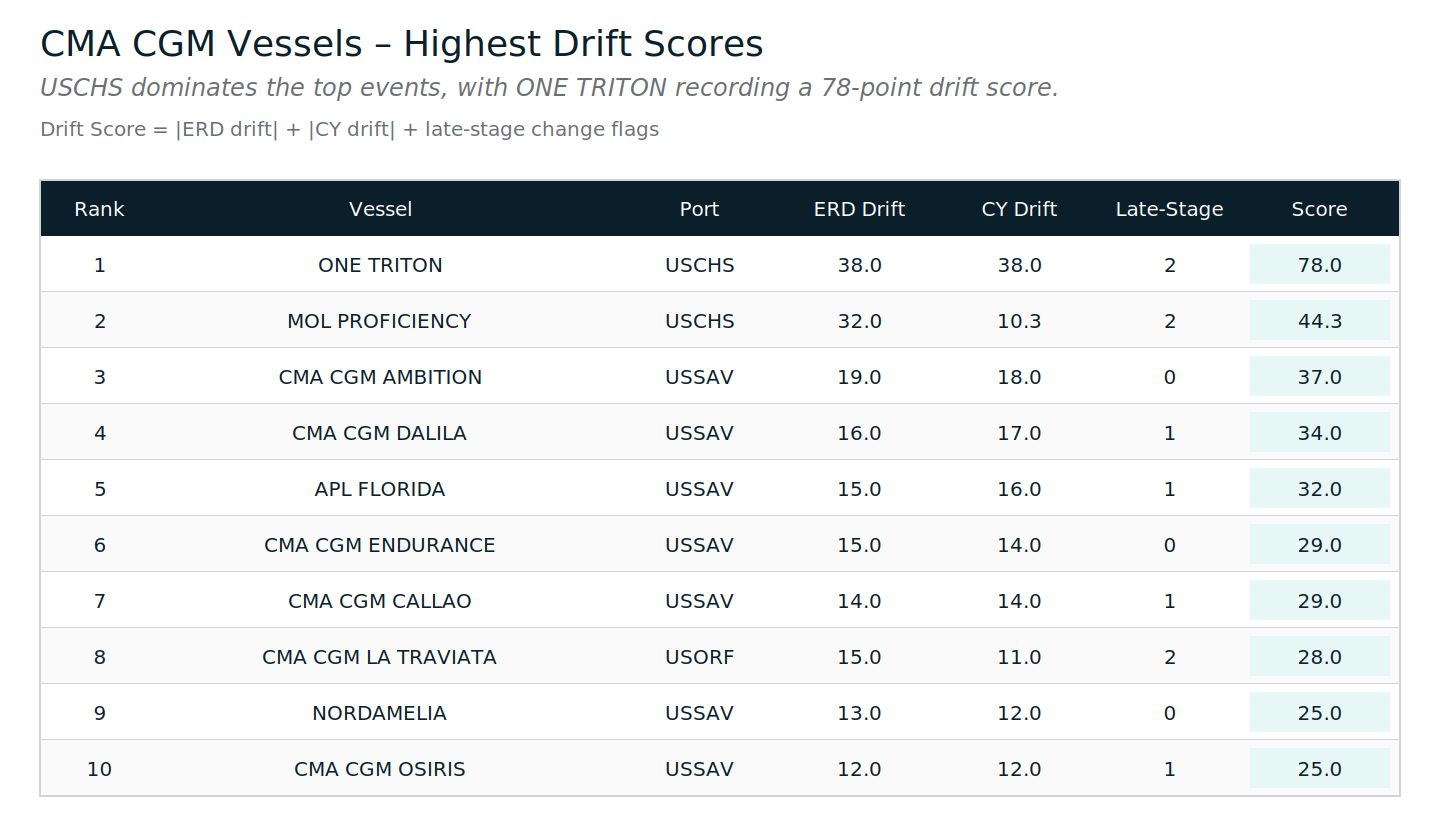
Plain English meaning:
These events are not typical - they are stress tests that show how quickly drift can stack when multiple changes coincide.
Top examples in this sample:
- ONE TRITON (USCHS): ERD 38d, CY 38d, late-stage 2, drift score 78
- MOL PROFICIENCY (USCHS): ERD 32d, CY 10.3d, late-stage 2, drift score 44.3
- CMA CGM AMBITION (USSAV): ERD 19d, CY 18d, late-stage 0, drift score 37
Static buffers fail in these scenarios by design.
Section 7 - The KPI that matters for CMA CGM
Figure 7 - Receiving Window Movement Rate (CMA CGM)
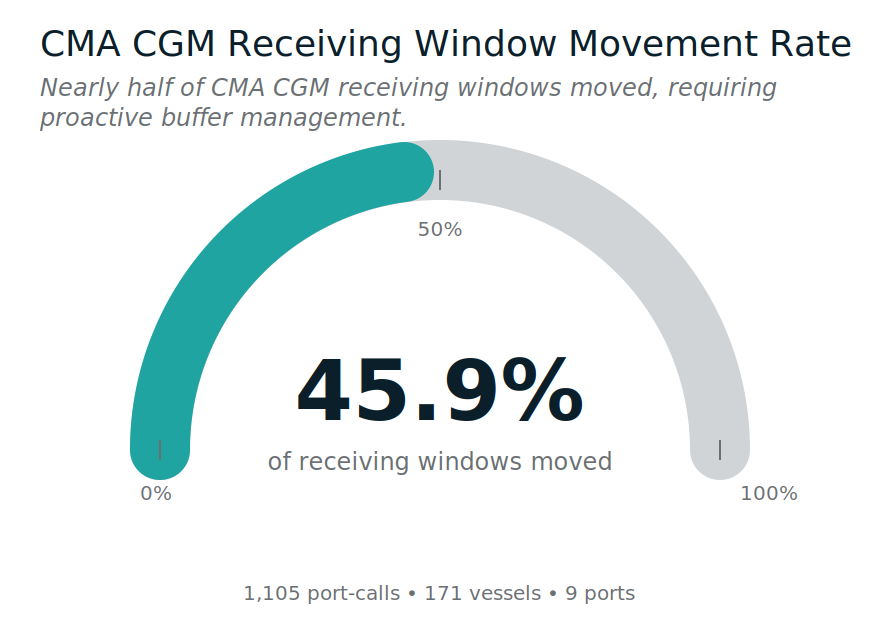
- Moved receiving windows: 45.88%
- Stable receiving windows: 54.12%
- Scope: 1,105 port-calls - 171 vessels - 9 ports
Plain English meaning:
CMA CGM’s receiving-window stability is the majority state - but the movement rate remains high enough that predictability has to be managed explicitly. Arrival-based reliability metrics will not explain the day-to-day execution breaks exporters feel.
Section 8 - Why static buffers fail (and why this repeats)
Figure 8 - Static Buffer vs Dynamic Time Buffer (DTB)
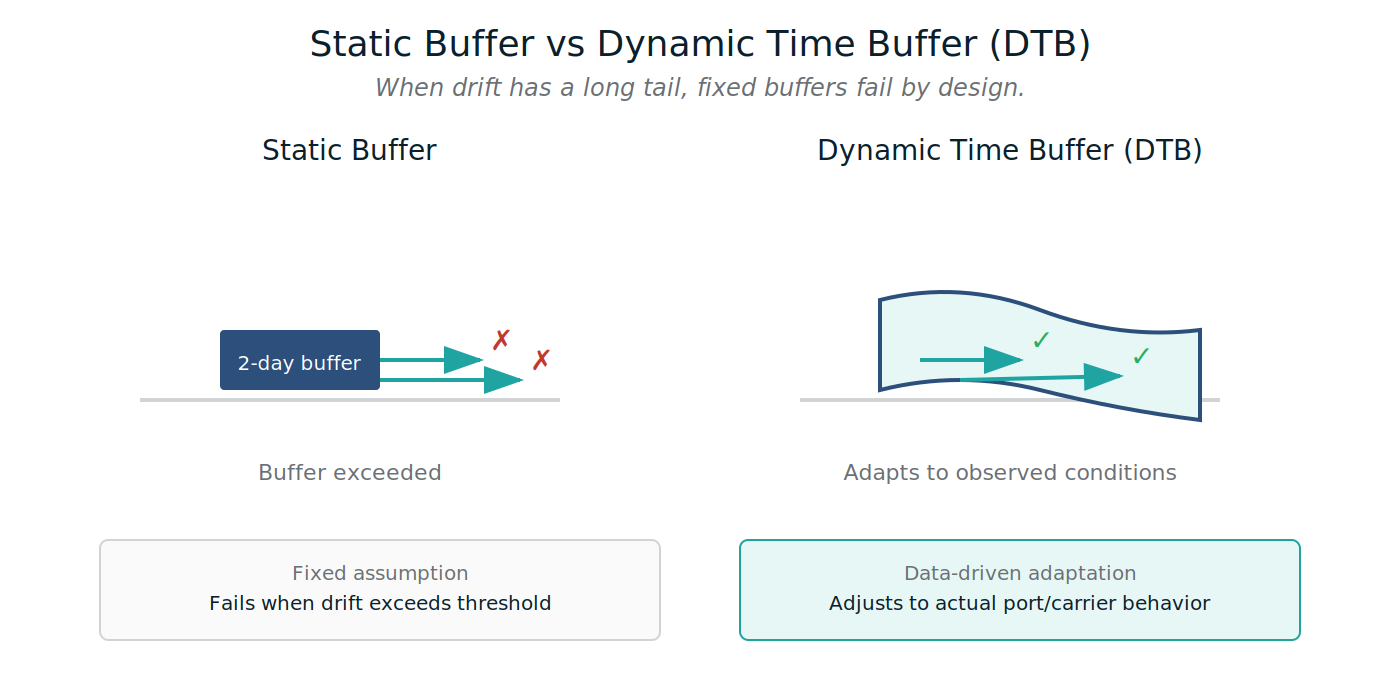
Plain English meaning:
When drift has a long tail and late-stage changes are common, fixed buffers are routinely exceeded. Planning must adapt to observed behavior, not assumptions.
Before we move to the next carrier
A vessel can be “on time” and still break export execution if the receiving window shifts underneath it.
This CMA CGM edition shows:
- stable windows are the majority state, but movement remains frequent,
- CY Cutoffs drift materially more than ERDs,
- and late-stage changes are common enough to explain why plans often break after they feel locked.
Methodology and definitions:
Reliability Series - Methodology Appendix
https://www.tradelanes.co/blog/reliability-series-methodology-appendix
Next in the Carrier Reliability Series
Evergreen - publishing soon.


Leave a Comment