Why this article exists (before we look at any charts)
In the System Baseline edition of The Reliability Illusion, we established a simple but critical shift:
Vessel schedule reliability doesn’t break at arrival.
It breaks inside the cargo receiving window.
That window - defined by the Earliest Return Date (ERD) and CY Cutoff - is where export execution actually happens.
This edition applies the same framework to ZIM (ZIMU) to understand how cargo receiving windows behave in practice - where they stay predictable, and where they don’t.
All terms used here are defined in the Reliability Series - Methodology Appendix:
https://www.tradelanes.co/blog/reliability-series-methodology-appendix
Data scope (ZIM sample)
This analysis is based on an observational system sample of executable export port-calls and is not a statistically randomized sample.
- Port-calls: 120
- Vessels: 75
- Ports: 4
- Carrier: ZIMU (ZIM)
Filters applied:
- ERD and CY Cutoff both required
- Drift >40 days treated as data error and excluded
Section 1 - How often do ZIM receiving windows actually move?
A receiving window is considered moved if either ERD or CY Cutoff shifts by one calendar day or more from its originally published value.
Figure 1 - Receiving Window Stability (ZIM)
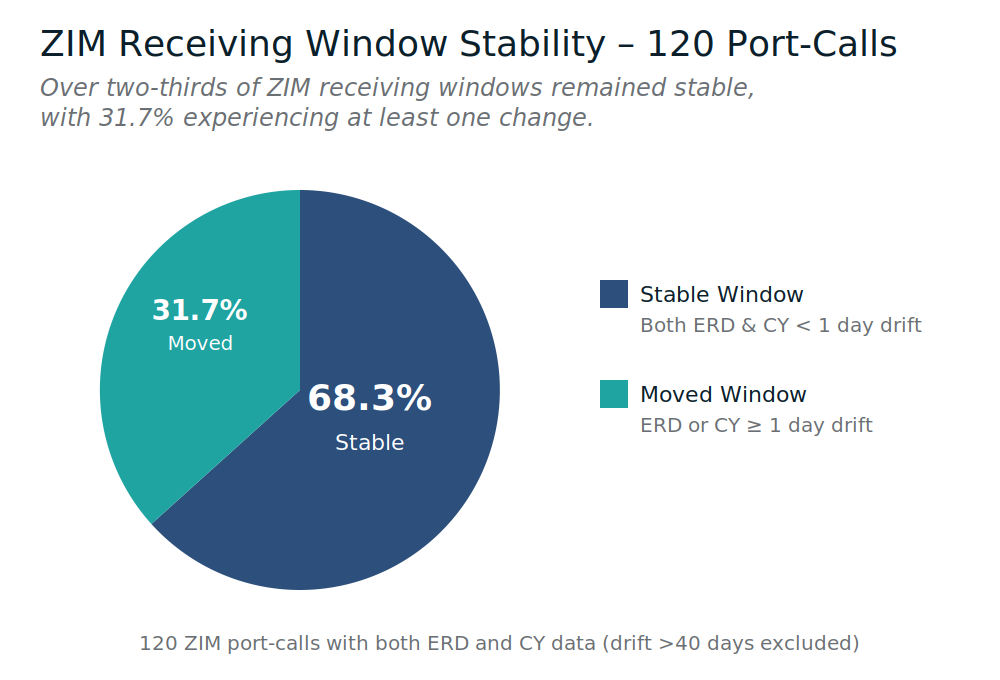
- Stable receiving windows: 68.33%
- Moved receiving windows: 31.67%
Plain English meaning:
In this sample, ZIM receiving windows are stable in a clear majority of port-calls. But nearly one in three still move, which is enough to create recurring execution breaks - especially when changes land late.
Section 2 - Drift isn’t chaos; it has a shape
Drift measures how far ERDs or CY Cutoffs move between original and final values, expressed in calendar days.
Figure 2 - ERD Drift Distribution (ZIM)
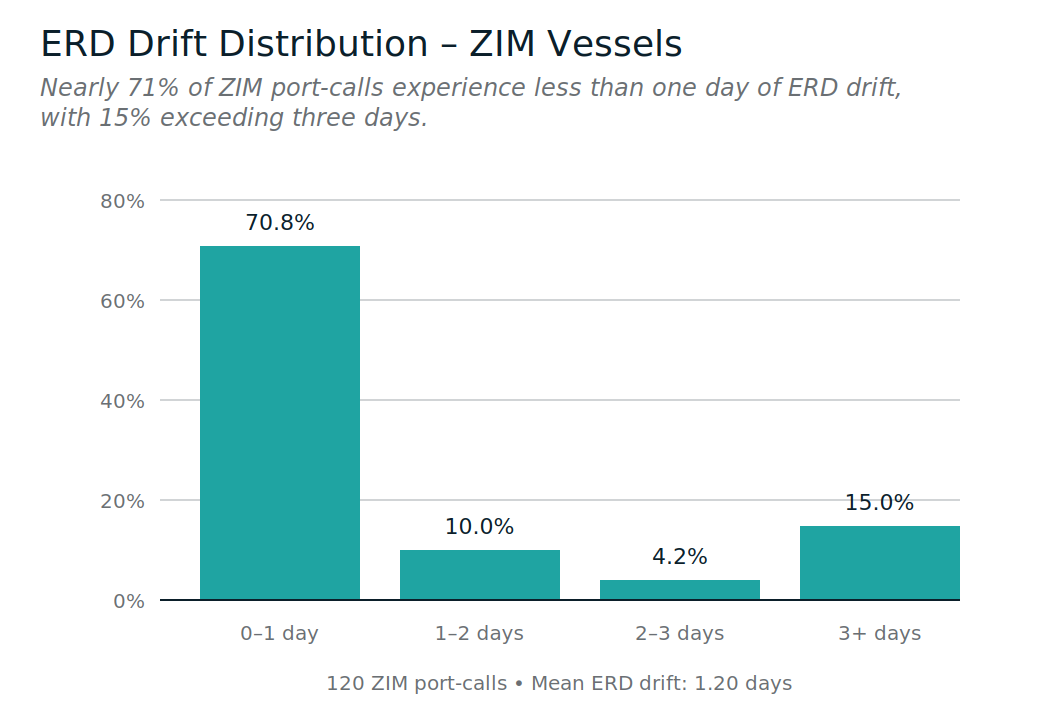
- 0-1 day: 70.83%
- 1-2 days: 10.00%
- 2-3 days: 4.17%
- 3+ days: 15.00%
Plain English meaning:
Most ZIM ERD movement is small, but the tail still matters: 15% of port-calls experienced 3+ days of ERD drift.
Static buffers are built for the middle of the curve.
Operational pain lives in the tail.
Section 3 - CY cutoffs are where risk concentrates for ZIM
Across the ZIM sample, CY Cutoff drift exceeds ERD drift.
Figure 3 - ERD vs CY Drift (ZIM)
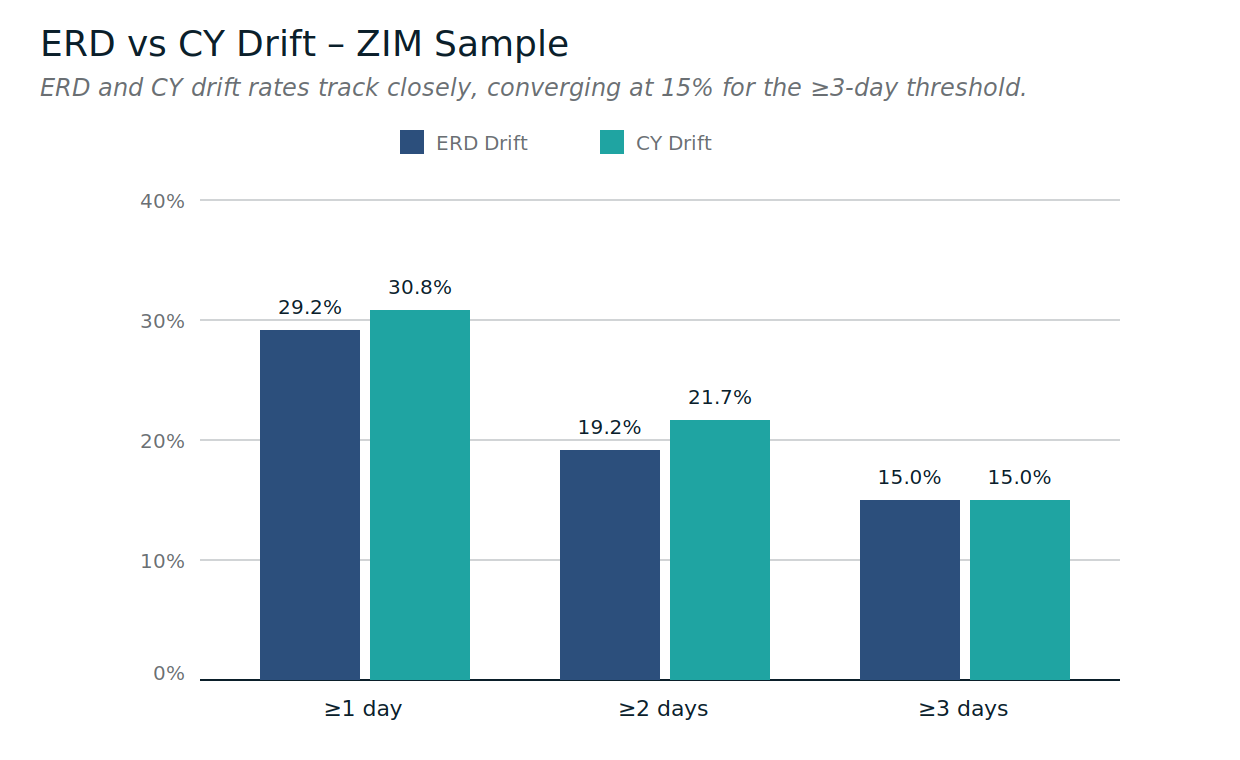
Average drift
- Mean ERD drift: 1.20 days
- Mean CY drift: 1.25 days
Threshold comparison
- ≥1 day drift: ERD 29.17% vs CY 30.83%
- ≥2 days drift: ERD 19.17% vs CY 21.67%
- ≥3 days drift: ERD 15.00% vs CY 15.00%
Plain English meaning:
The gap between ERD and CY is smaller here than in some other carrier editions, but the pattern still holds: CY Cutoffs drift slightly more often, and that is where the execution constraint tends to surface.
Section 4 - Timing matters more than averages
A late-stage change is defined as a change to ERD or CY Cutoff that occurs within the final 72 hours before the receiving window opens.
Figure 4 - Late-Stage Receiving Window Changes (ZIM)
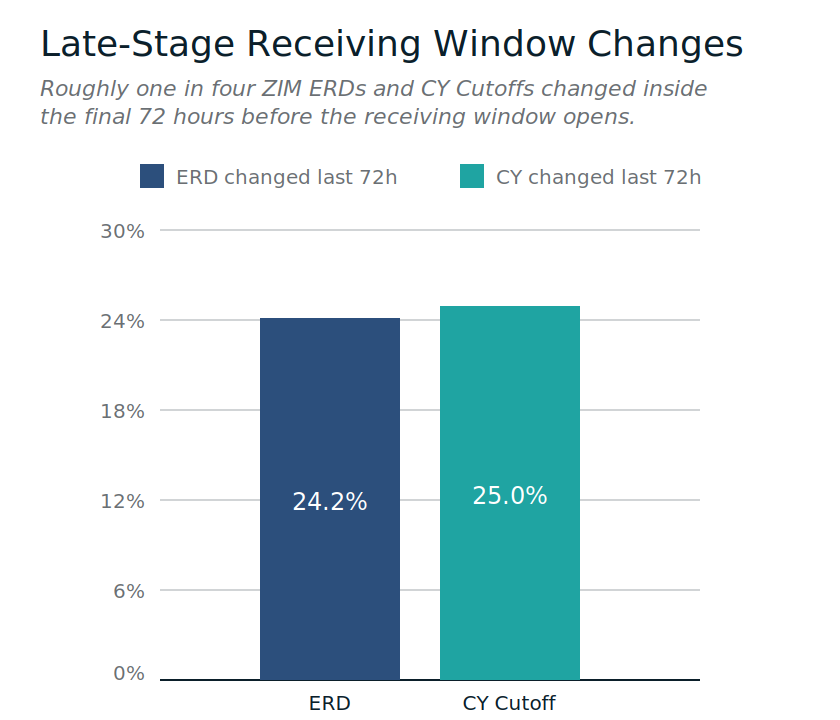
- ERD changed in last 72 hours: 24.17%
- CY Cutoff changed in last 72 hours: 25.00%
Plain English meaning:
About one in four ZIM ERDs and CY Cutoffs changed inside the final 72 hours - which helps explain why exporters can still experience disruption even when overall stability looks relatively strong.
So far, we’ve looked at how windows move.
Next, we look at where.
Section 5 - Volatility is not evenly distributed across terminals (ZIM)
The Port Volatility Index (PVI) reflects how quickly static planning assumptions break at a port.
Figure 5 - Port-Level Drift (ZIM)
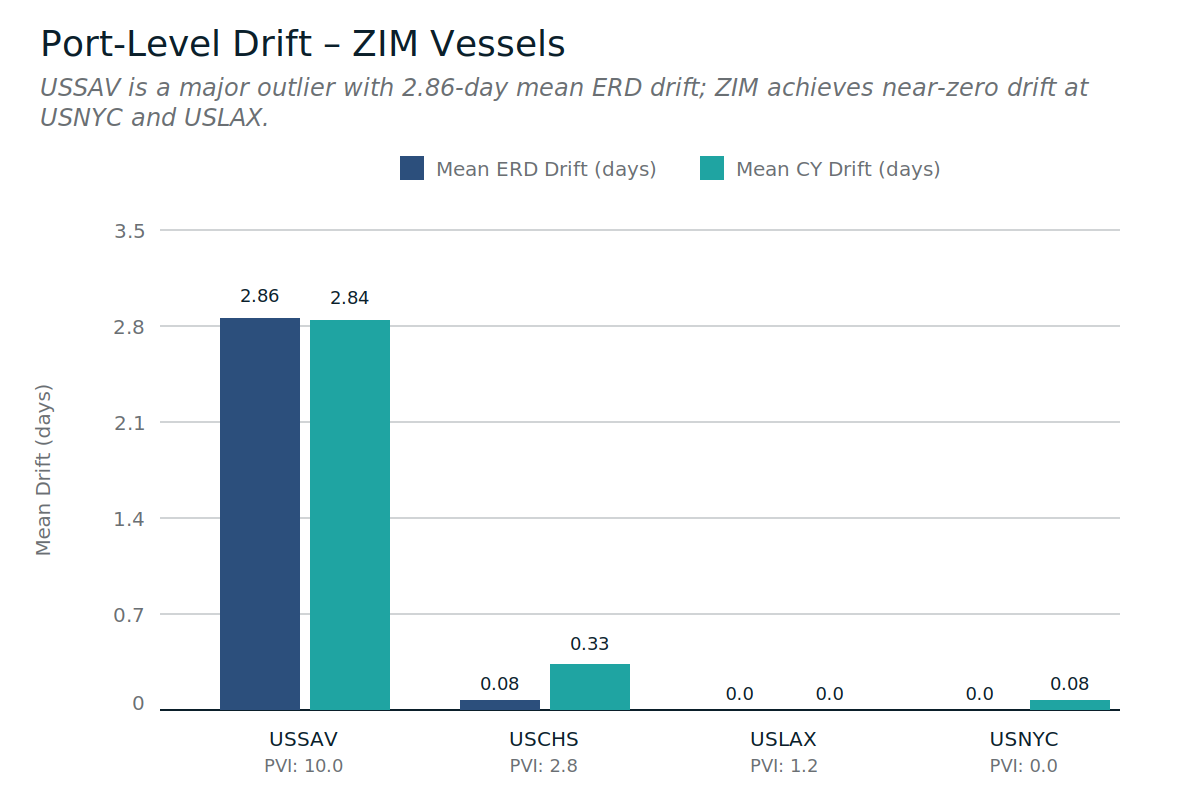
Below are the ports in this ZIM sample, ordered by PVI.
USSAV (PVI 10.0, n=50)
- Mean ERD drift: 2.86 days
- Mean CY drift: 2.84 days
- Stable window rate: 32.00%
- ERD late-stage change: 54.00%
- CY late-stage change: 36.00%
What this feels like:
This is where the ZIM volatility concentrates. Plans often need re-work, and a meaningful share of changes land late.
USCHS (PVI 2.8, n=12)
- Mean ERD drift: 0.08 days
- Mean CY drift: 0.33 days
- Stable window rate: 83.33%
- CY late-stage change: 75.00% (small sample)
What this feels like:
Small sample, but the signal is clear: low average drift can still hide late-stage change risk.
USLAX (PVI 1.2, n=9)
- Mean ERD drift: 0.00 days
- Mean CY drift: 0.00 days
- Stable window rate: 100.00%
- ERD late-stage change: 22.22%
- CY late-stage change: 22.22%
What this feels like:
A very stable environment in this sample.
USNYC (PVI 0.0, n=49)
- Mean ERD drift: 0.00 days
- Mean CY drift: 0.08 days
- Stable window rate: 95.92%
- CY late-stage change: 2.04%
What this feels like:
High predictability and limited late-stage change in this sample.
Section 6 - Severity still exists, even when averages look manageable
Figure 6 - Top 10 Highest-Severity ZIM Events
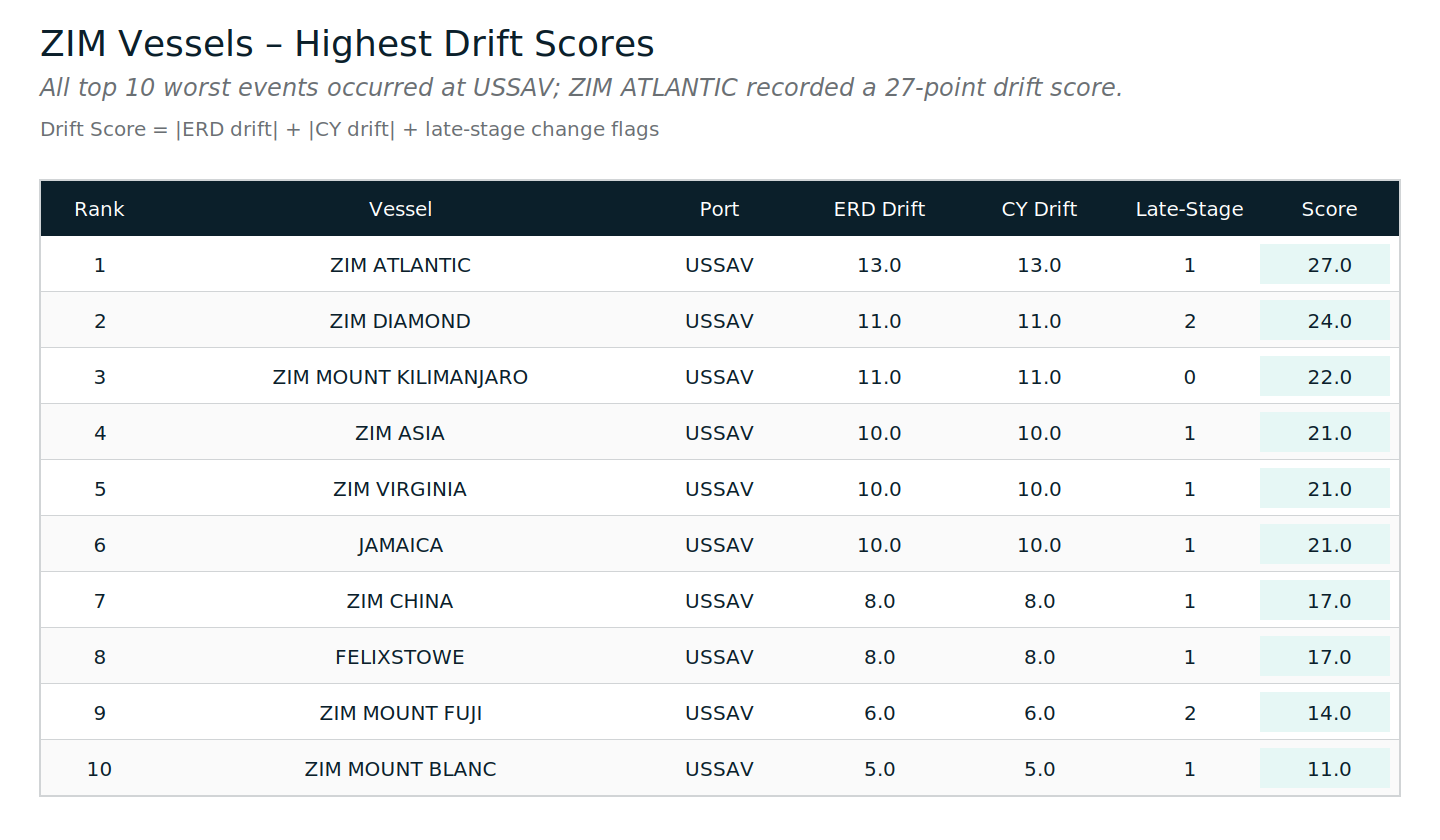
Top examples:
- ZIM ATLANTIC (USSAV): ERD 13d, CY 13d, late-stage 1, score 27
- ZIM DIAMOND (USSAV): ERD 11d, CY 11d, late-stage 2, score 24
- ZIM MOUNT KILIMANJARO (USSAV): ERD 11d, CY 11d, late-stage 0, score 22
Plain English meaning:
These are stress tests, not typical shipments. They show how quickly drift can stack when multiple changes coincide - especially in the high-volatility port environments.
Static buffers fail in these scenarios by design.
Section 7 - The KPI that matters for ZIM
Figure 7 - Receiving Window Movement Rate (ZIM)
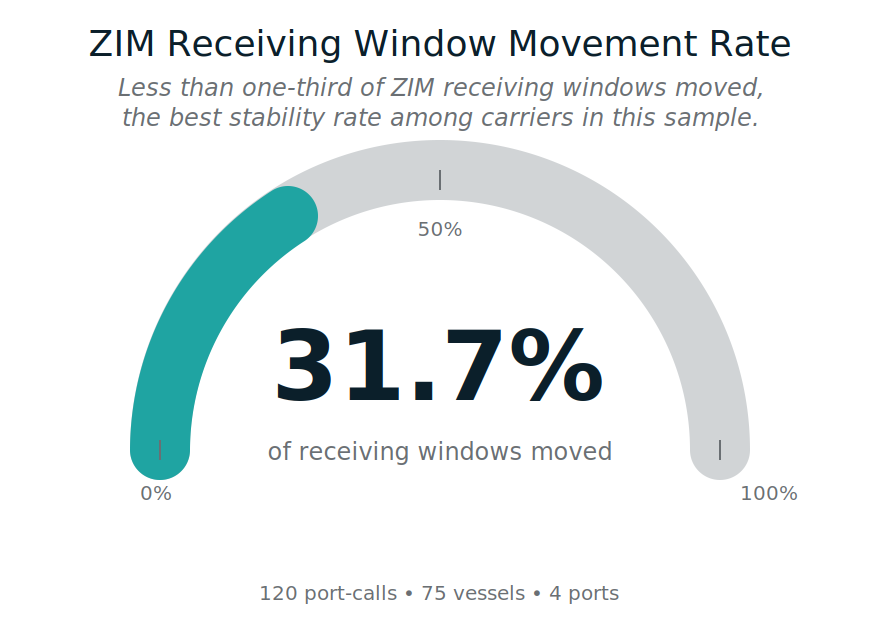
- Moved receiving windows: 31.67%
- Stable receiving windows: 68.33%
- Scope: 120 port-calls • 75 vessels • 4 ports
Plain English meaning:
For ZIM in this sample, stability is the majority state. The operational risk shows up in two places: the tail of large drift events, and the timing of late-stage changes.
Section 8 - Why static buffers fail (and why this repeats)
Figure 8 - Static Buffer vs Dynamic Time Buffer (DTB)
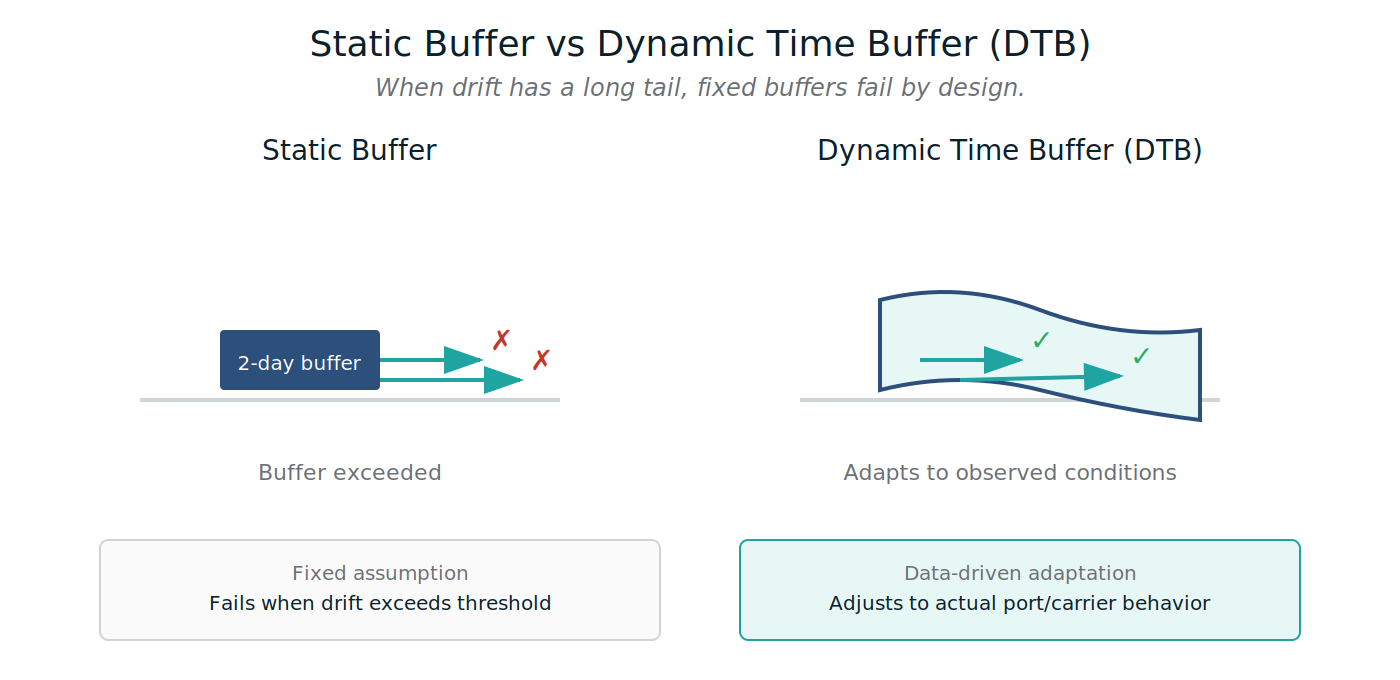
Plain English meaning:
When drift has a long tail and late-stage changes are common, fixed buffers are routinely exceeded. Planning must adapt to observed behavior, not assumptions.
Before we move to the next carrier
A vessel can be “on time” and still break export execution if the receiving window shifts underneath it.
This ZIM edition shows:
- receiving windows are stable in the majority of port-calls,
- late-stage change is still common enough to disrupt execution, and
- volatility is concentrated by port - with USSAV carrying the highest volatility signal in this sample.
Methodology and definitions:
Reliability Series - Methodology Appendix
https://www.tradelanes.co/blog/reliability-series-methodology-appendix
Next in the Carrier Reliability Series
Yang Ming - publishing next.


Leave a Comment