How “Ninety Percent On-Time” Falls Apart the Moment You Track Receiving Windows
The last few months have been full of confident claims about Gemini. Analysts described it as a return to stability. Carriers repeated the same line. The message was simple: on-time performance is back.
But the moment you stop looking at proforma arrivals and start following the movement inside receiving windows, the picture changes fast. When we ran Gemini vessels through Ava’s actual ERD and CY Cutoff data, the story that emerged had almost nothing to do with “ninety percent on time.” (Ava is the name of the TradeLanes Vessel Schedule Monitor).
Gemini may meet its own definition of punctuality. Exporters, however, live inside a receiving window that moves.
Across a random sample of 78 Gemini port-calls, covering 15 vessels and eight ports, the receiving window told a very different story.
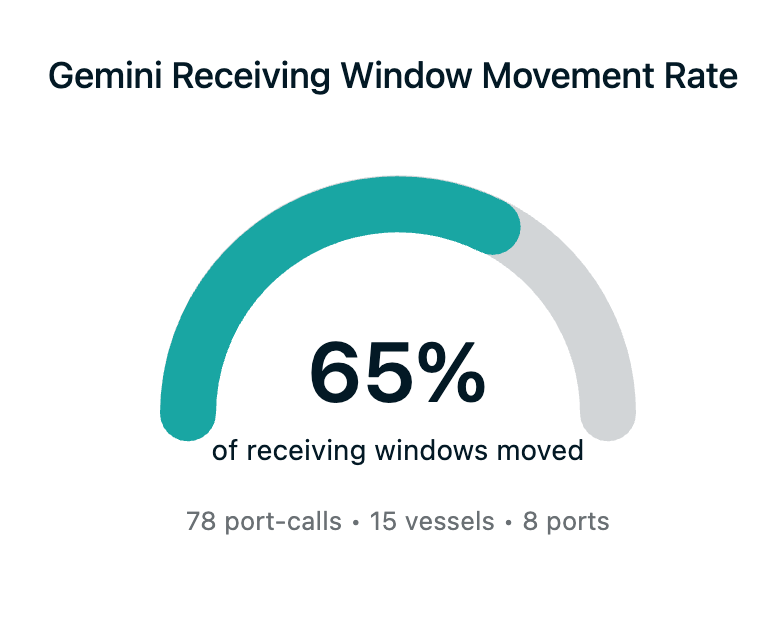
1. The Gemini Reality in One Number
When both ERD and CY were present and trackable, only a third of Gemini port-calls kept a stable window. Two out of three moved at least once.
Only 35 percent of port-calls maintained a stable ERD and CY Cut (both moved less than 1 day). That means 65 percent of Gemini receiving windows moved at least once.
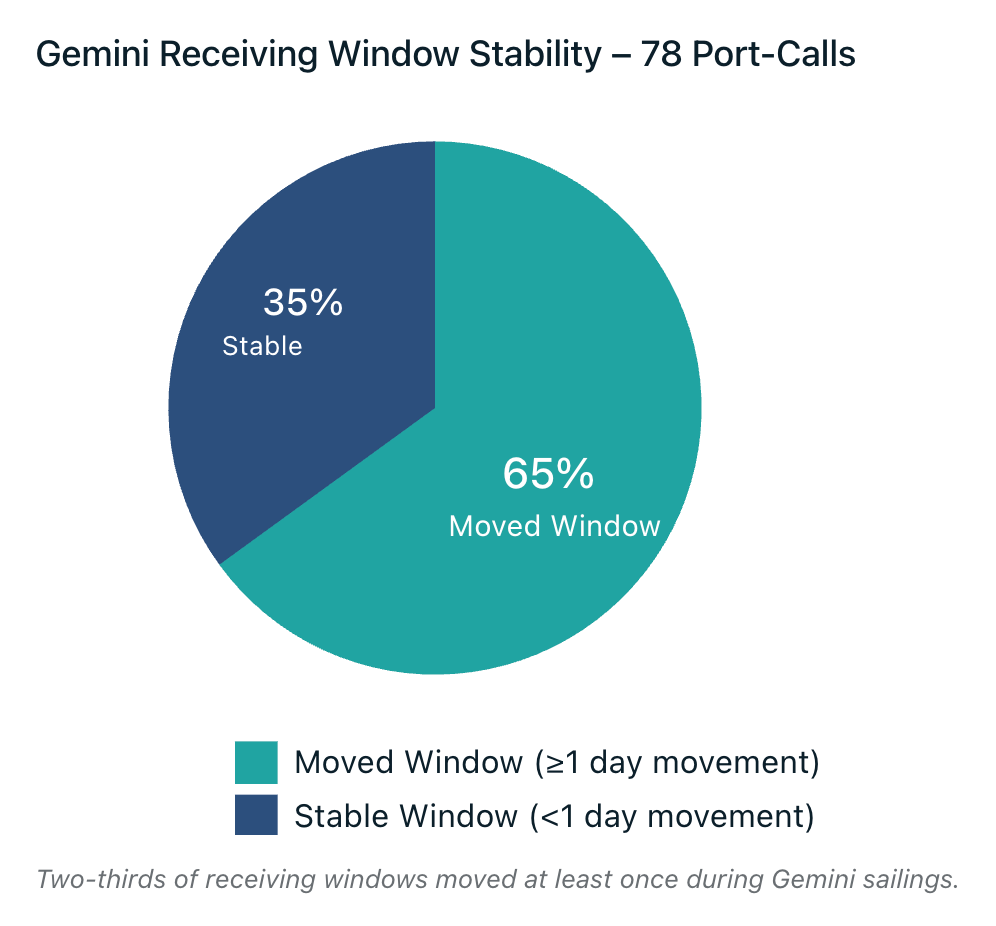
Shows: 35 percent stable windows vs 65 percent moving windows. Purpose: illustrates the reliability illusion at a glance.
That is the gap between the published version of reliability and the lived version of reliability.
Only 1 in 3 Gemini sailings gave exporters a truly stable receiving window. Two out of three moved the goalposts.
Carriers measure punctuality against the schedule they created. Exporters measure it against a window that must stay still long enough to plan labor, drayage, inspections, and documentation. On Gemini, that window held steady only 35 percent of the time.
The day-to-day reality is that exporters spent two-thirds of sailings adjusting to movement the industry narrative said was gone.
2. The Drift Behind the Marketing
ERD drift - where planning buffer disappears
Across all Gemini calls in our sample, ERD movement behaved less like a premium product and more like a fabric that stretches quietly, long before anyone feels the pull.
- Mean ERD drift landed at 1.1 days absolute.
- A third of port-calls saw ERD move by at least a day.
- One in five saw drift of 2 days or more.
- Twelve percent crossed the 3-day mark.
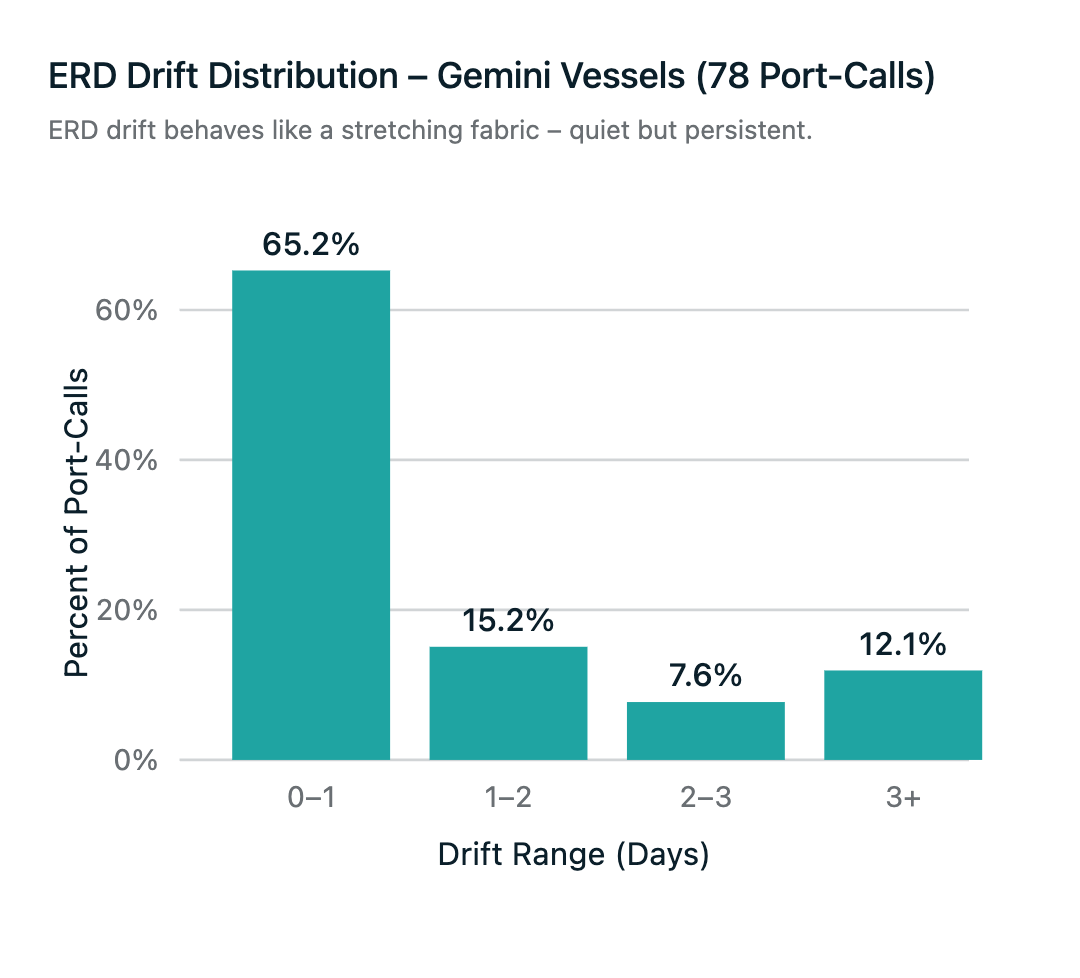
Shows: 0–1 day, 1–2 days, 2–3 days, 3+ days slices. Purpose: demonstrates that drift is not occasional noise but a structural pattern.
None of this looks catastrophic on its own. But when you follow the pattern instead of the update, you see an erosion of buffer that compounds as each week progresses.
Exporters don’t lose time all at once. They lose it in slices.
CY drift - where roll risk takes shape
CY drift is where Gemini’s narrative breaks apart entirely.
Across the dataset:
- Mean CY drift: 2.0 days
- Half of all calls saw CY move by a day or more
- Nearly a third saw movement of 2+ days
- Close to one in five crossed 3 days
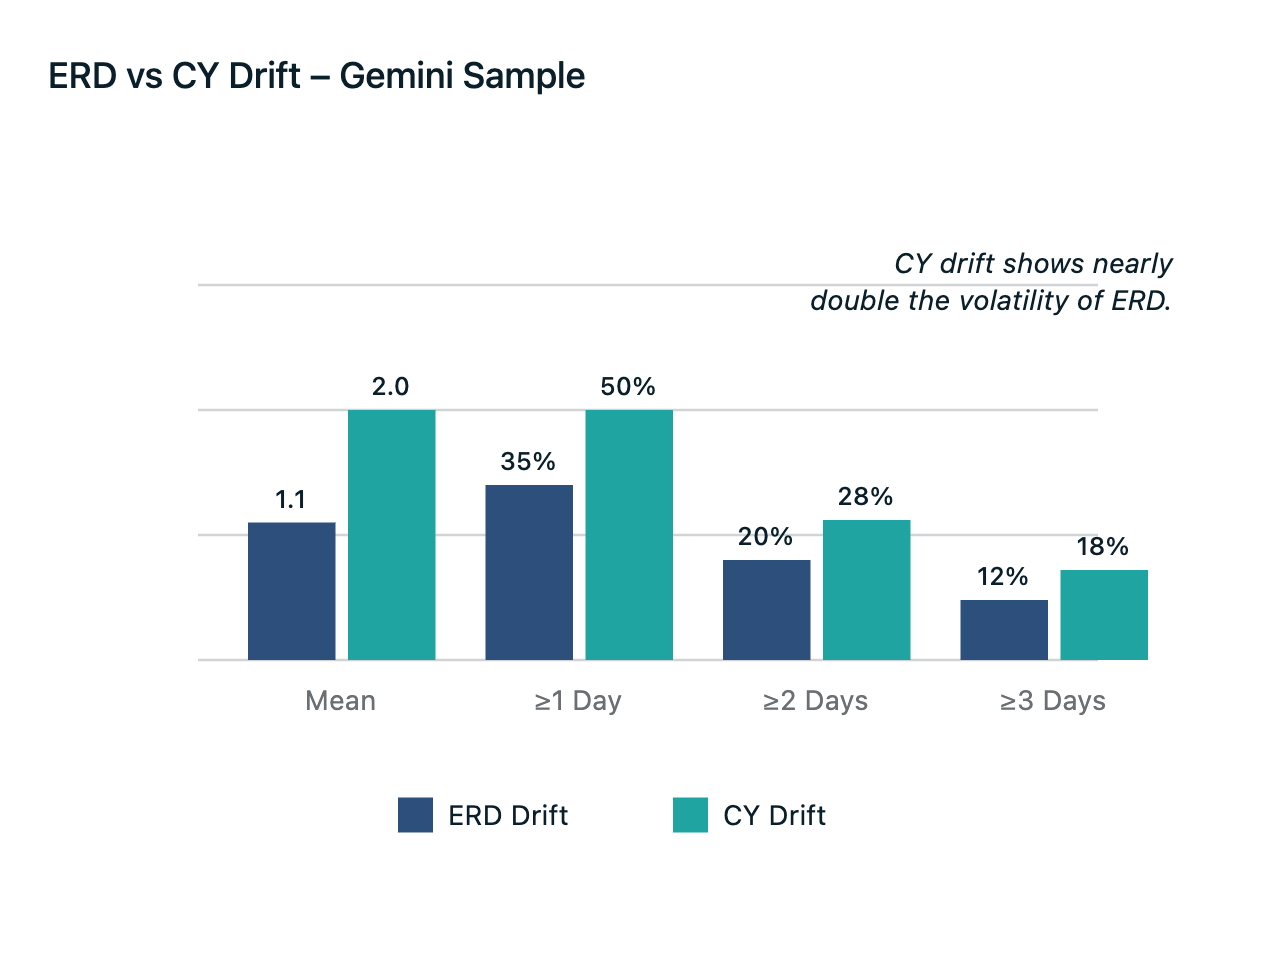
Shows: ERD mean vs CY mean; percentage in each drift band. Purpose: makes CY volatility visually undeniable.
Cutoff drift is not a nuisance. It is the primary driver of roll risk, last-minute yard surprises, and documentation compression. And on Gemini, it is the rule, not the exception.
3. The Last-72-Hour Shock
This is the window exporters plan around. It is also where Gemini’s stability disappears.
Inside the last 72 hours before the cargo receiving window opened:
- ERD changed on 12 percent of port-calls
- CY changed on 17 percent
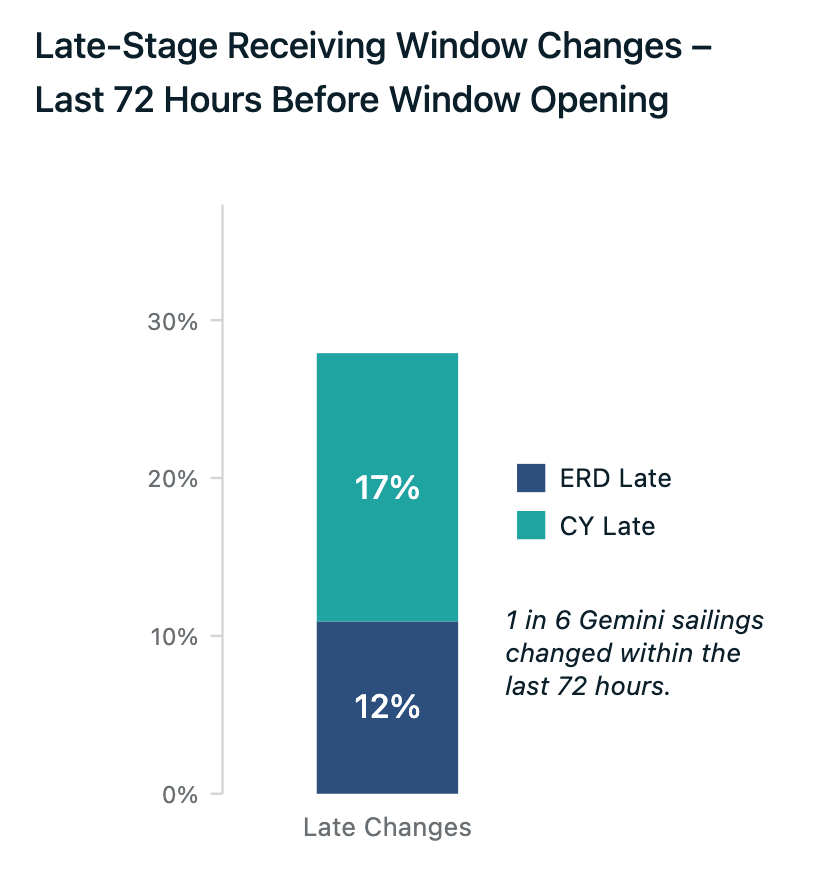
Shows: percent of port-calls with late ERD changes vs late CY changes. Purpose: illustrates how close-to-opening volatility impacts planning.
In practice, that means one in six Gemini sailings shifted the receiving window in the final three days before it was supposed to open.
A vessel can still look “on time” on paper while blowing up reefer set-ups, USDA holds, drayage appointments, and cross-dock plans. The receiving window, not the proforma arrival, is where exporters experience pain. The last-72-hour zone is exactly where Ava watches the movement most closely.
4. Port-Level Signals - Where Gemini Actually Hurts
The reliability story gets sharper when the data is sliced port by port.
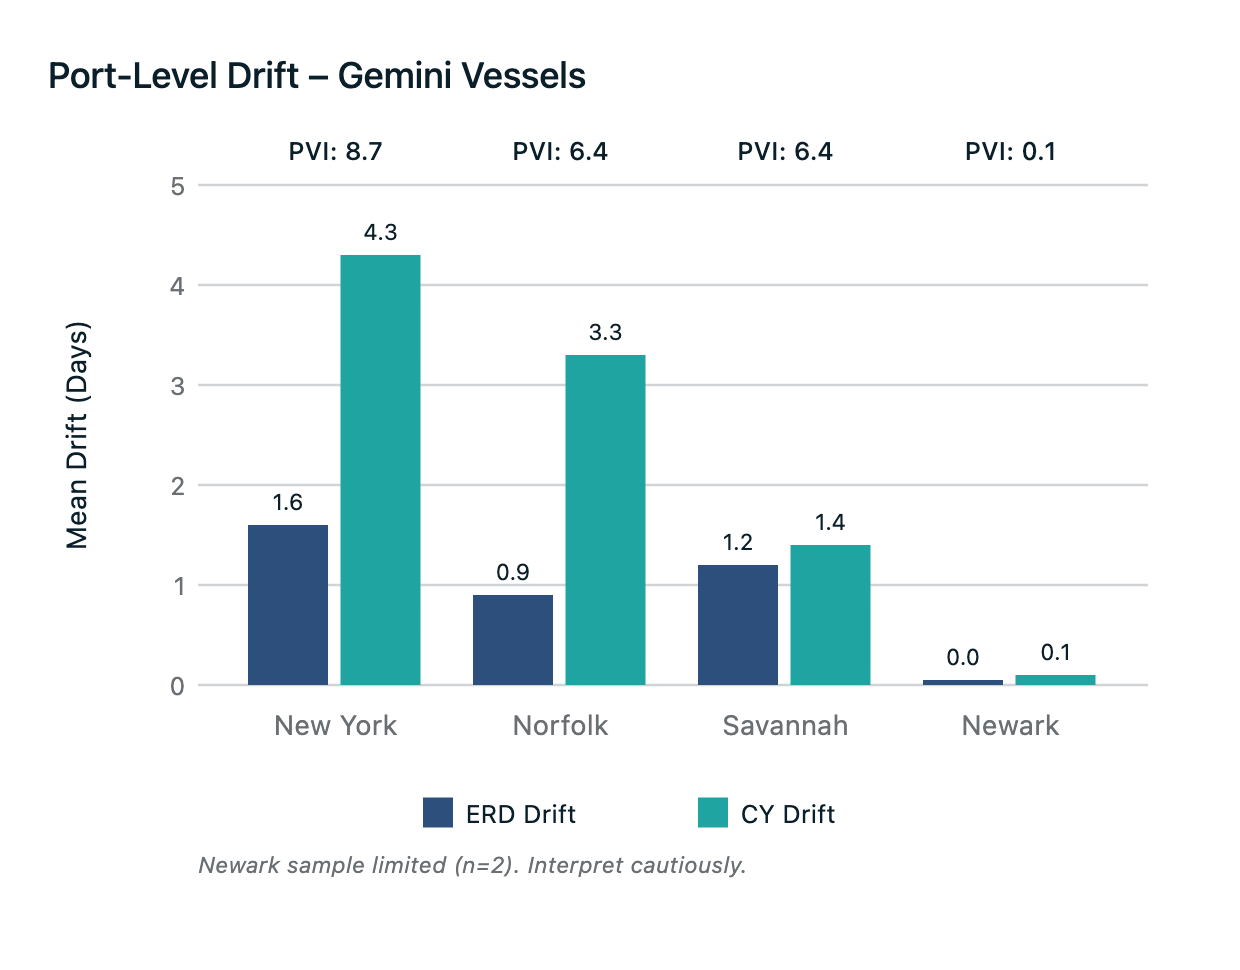
Shows: bar chart comparing ERD drift, CY drift, and PVI across Savannah, Norfolk, New York, and Newark. Purpose: communicates lane-specific volatility.
Savannah - slow, steady erosion of buffer
Across 29 sailings:
- Mean ERD drift: 1.2 days
- Mean CY drift: 1.4 days
- Late-stage changes on roughly a third of sailings
- Port Volatility Index: 1.0
Savannah’s pattern is a constant shaving of time. Nothing dramatic. Nothing headline-worthy. Just a quiet, persistent pull on every plan.
Norfolk - CY drift becomes structural
Across 29 sailings:
- Mean ERD drift: 0.9 days
- Mean CY drift: 3.3 days
- Port Volatility Index: 1.1
Norfolk is where drift stops being an inconvenience and becomes structural. CY drift of 3.3 days on average eats nearly the entire buffer export teams rely on. The ERD looks manageable. The cutoff does the damage.
New York - small sample, loud pattern
Across five sailings:
- Mean ERD drift: 1.6 days
- Mean CY drift: 4.3 days
- Forty percent of vessels saw multi-update schedules
- PVI: 1.6 (highest in the sample)
The pattern is unmistakable. Where Gemini touches New York, cutoff stability becomes optional.
Newark - appears calm, but the sample is too small
Two sailings. Near-zero drift. Not enough to generalize.
It is a reminder that reliability cannot be inferred from a single port, a single service, or a single marketing line.
5. The Ten Worst Gemini Vessels by Drift Score
When you combine ERD drift, CY drift, and late-stage changes using our own drift logic, the illusion becomes impossible to ignore.
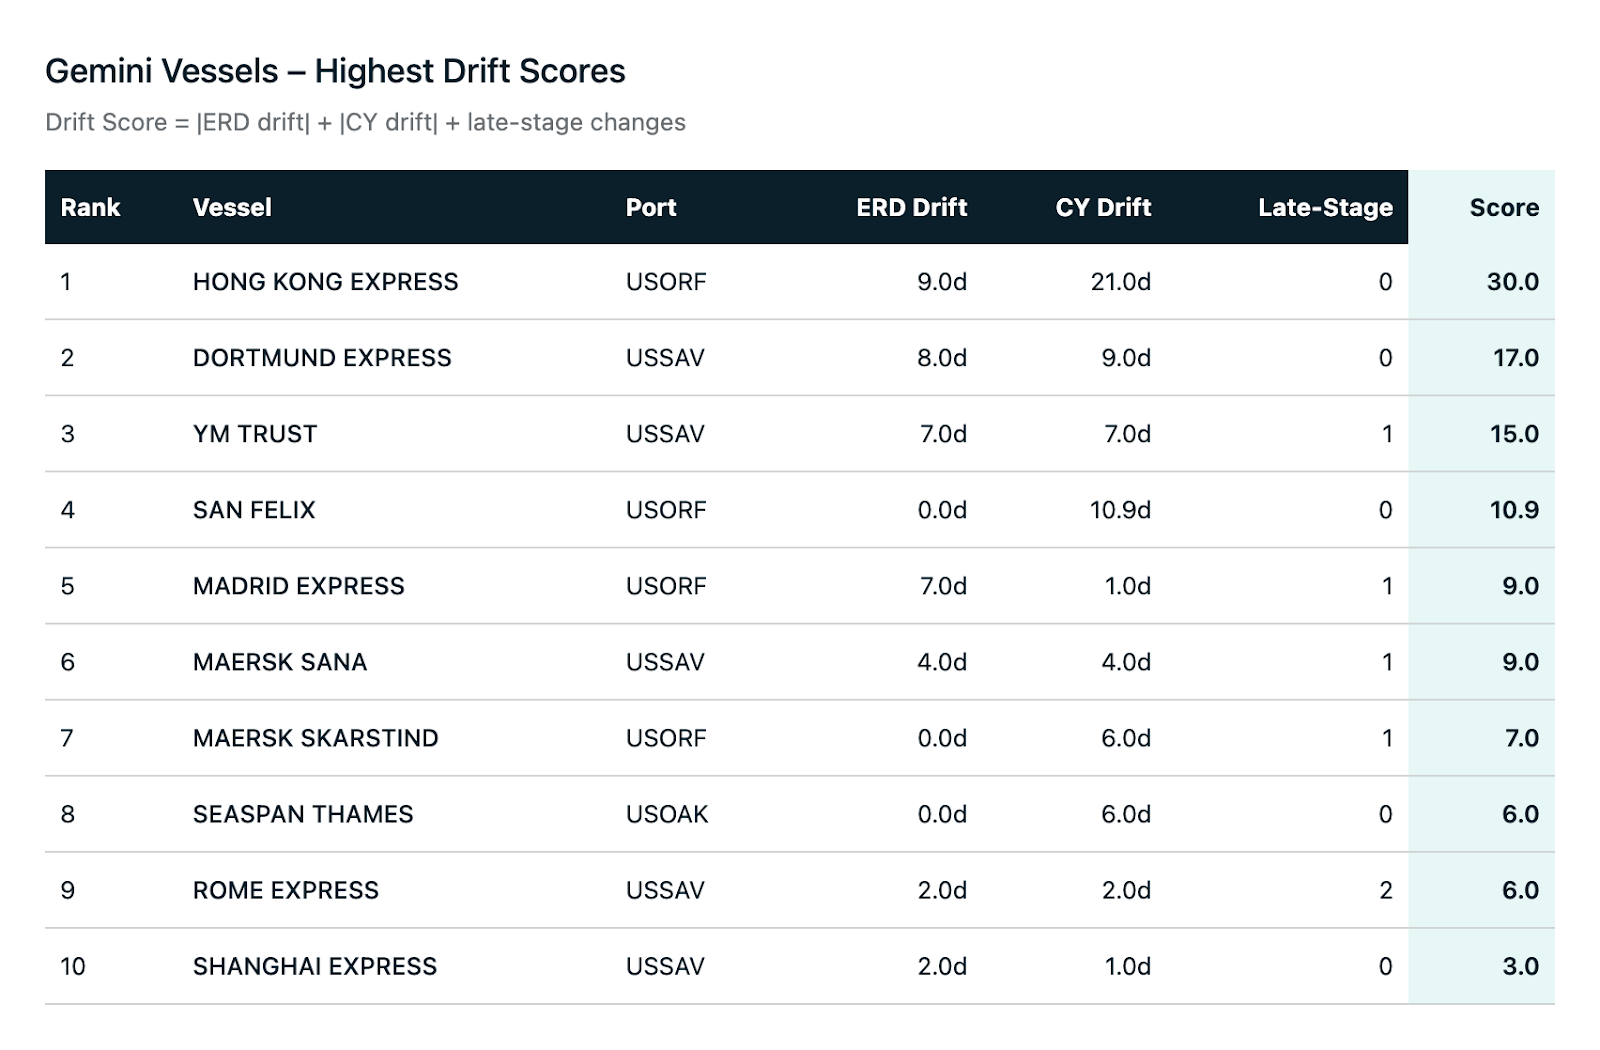
Columns: Vessel, Port, ERD Drift, CY Drift, Late-Stage Changes, Total Drift Score. Purpose: creates a definitive, scannable reference exporters can save or screenshot.
The top offenders included vessels posting CY drift of six, ten, and even twenty-one days. These are not rounding errors. These are planning failures that cascade down into documentation, drayage, and roll events.
You do not need opinions in the presence of these numbers.
This is the product exporters are being asked to trust.
6. The Reliability Illusion in One Line
Carriers track punctuality against their proforma.
Exporters live inside a cargo receiving window that moves.
On Gemini, that window moved on 65 percent of sailings.
Purpose: a single visual that reinforces the headline insight.
That is not reliability.
It is the illusion of reliability.
7. What Exporters Should Do Now
The Gemini data points to five practical steps.
1. Measure ERD and CY drift, not just arrivals.
The damage lives in the receiving window.
2. Watch previous-port delays and update lag.
When the terminal looks clean but the vessel is running late, the drift is already forming.
3. Replace static buffers with dynamic time buffers.
A fixed two-day buffer cannot survive multi-day CY movement.
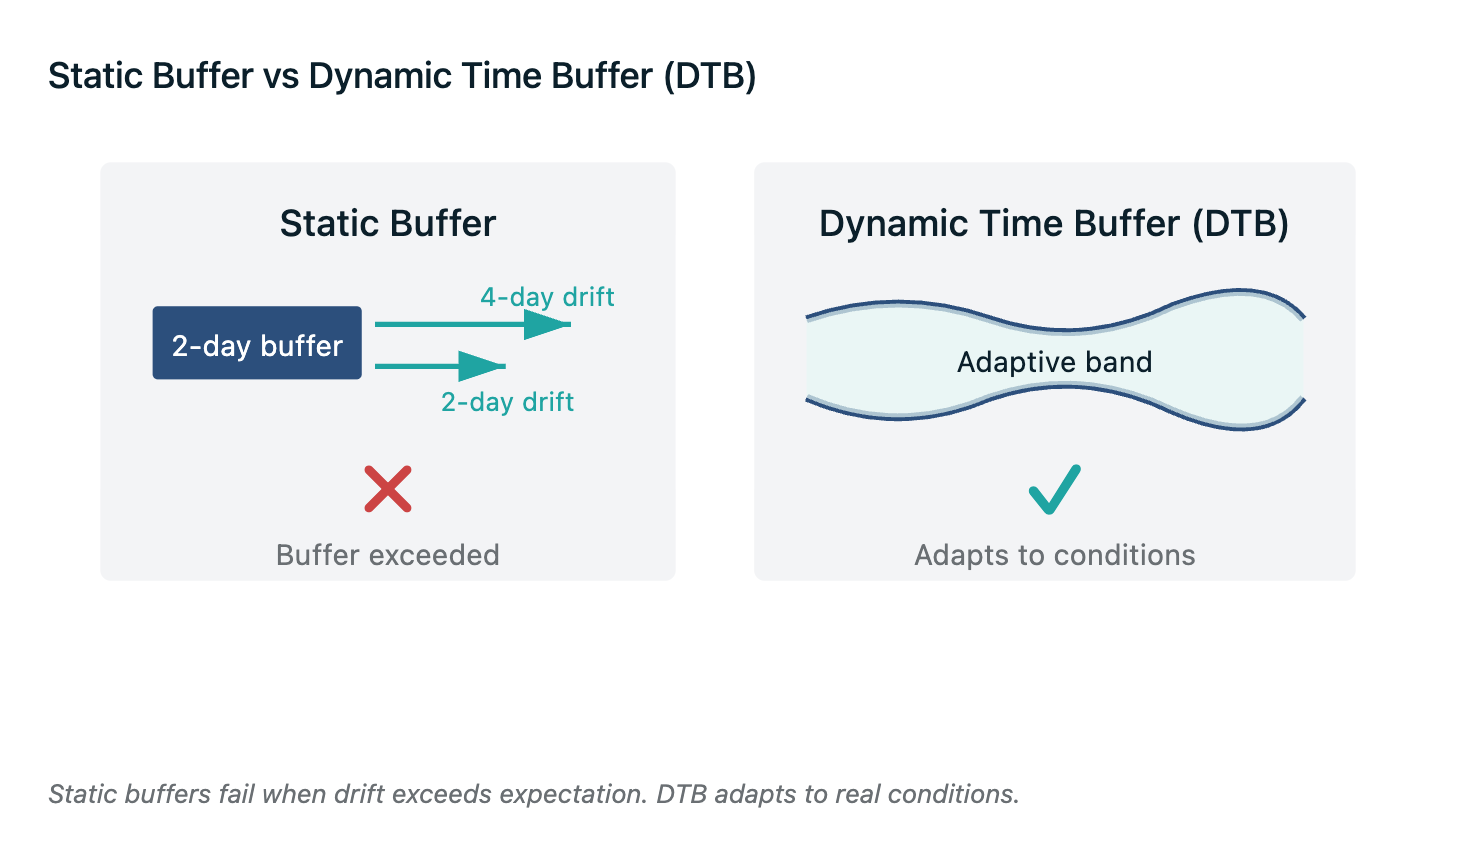
Shows: how a fixed buffer fails under multi-day drift; how DTB adapts.
4. Benchmark Gemini against window stability, not narrative.
Ask a single question: what percent of my Gemini windows stayed within one day?
5. Use vessel schedule intelligence to detect movement early.
If the receiving window is going to move, you want to see it before your options disappear.
Gemini is not a return to reliability. It is a new wrapper on the same volatility exporters have lived with for years.
What’s the Verdict on Gemini Reliability for Exporters?
Gemini did not fix schedule reliability.
It simply shifted attention away from the part exporters actually feel.


Leave a Comment