Why Checking Carrier Sites Twice a Day Is Not Risk Management
And Why Manual Monitoring Can’t Keep Up With How Risk Actually Forms
The Mismatch
Most export teams believe they’re managing risk.
They check carrier sites. They check terminal sites. They track updates. They react to changes.
It feels disciplined.
It isn’t.
Some teams check continuously. Some assign a person to track updates. The constraint is the same.
Across 5,828 U.S. export departures and 21,697 Cargo Receiving Window (CRW) change events:
- Median gap between changes: 7 hours
- 53.2% of changes arrive less than 12 hours apart
- A twice-daily cadence introduces a median detection lag of 8.5 hours
This is the mismatch:
You are operating on a human response cycle.
The system does not produce risk on one.
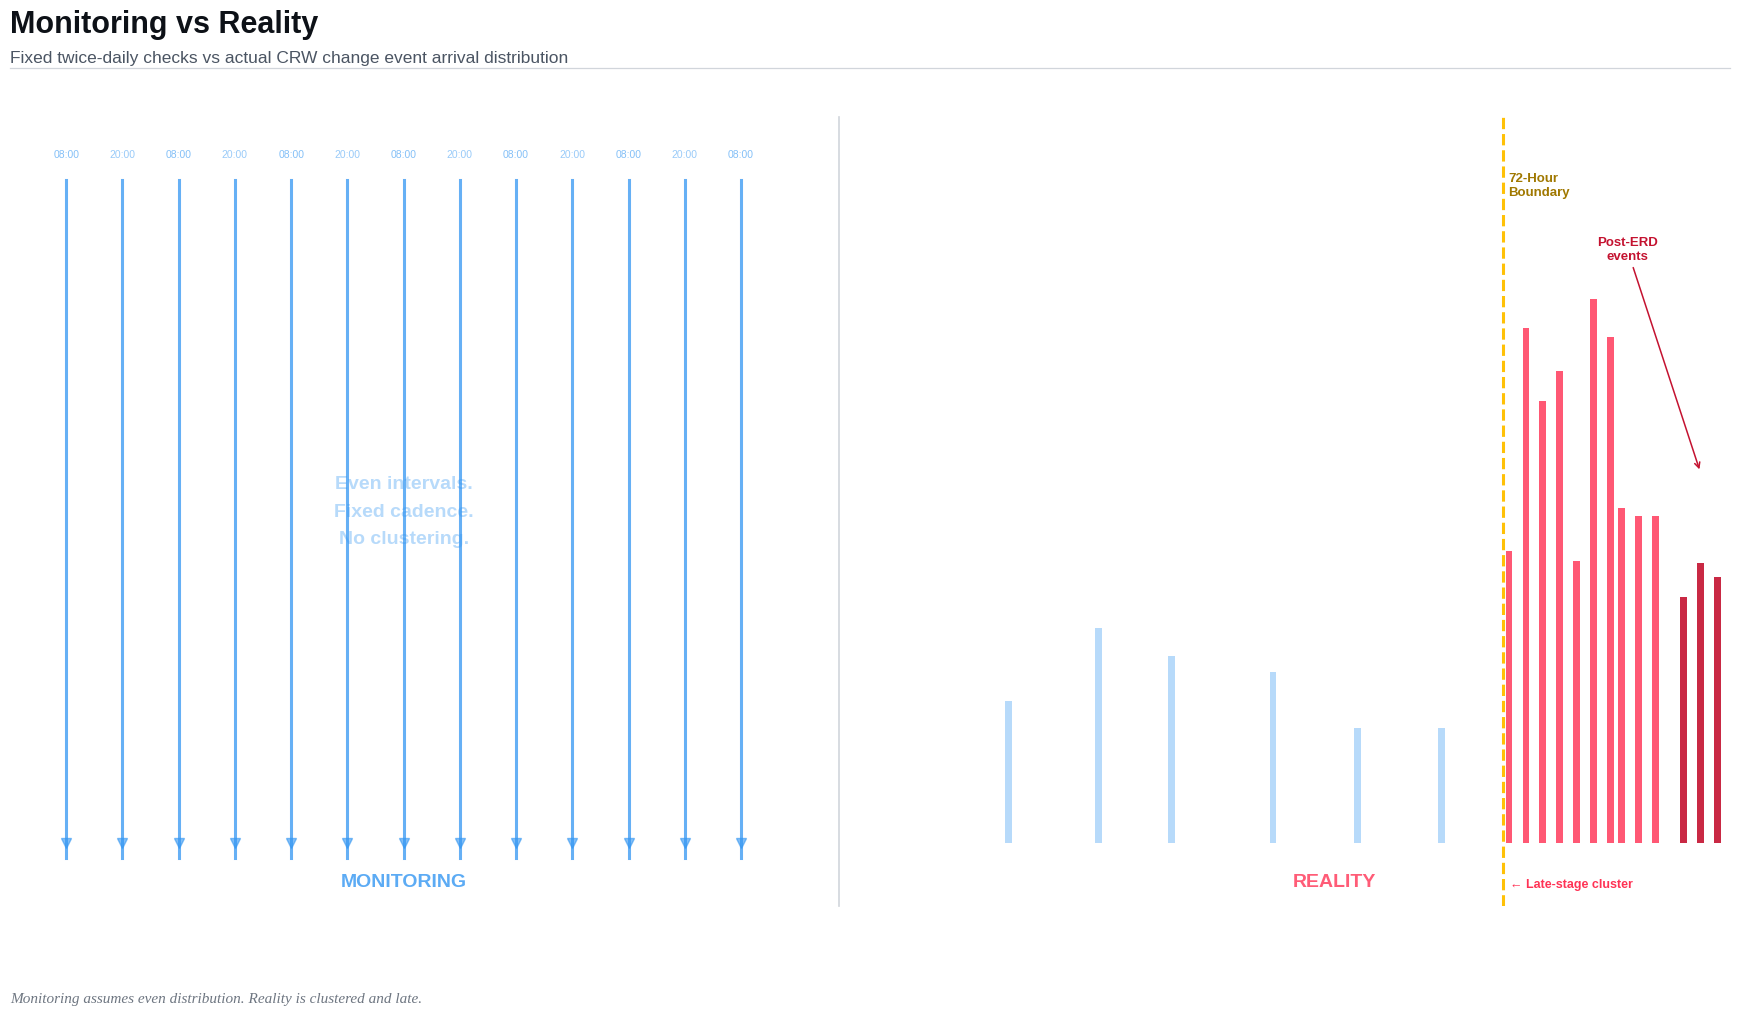
Figure 1 - The Illusion of Control
Monitoring cadence assumes even distribution. The system produces clustered signals.
The Window Was Never Executable
The standard assumption is that execution risk develops over time.
The data does not support that.
Rolled vessels don’t lose their window.
They start without one.
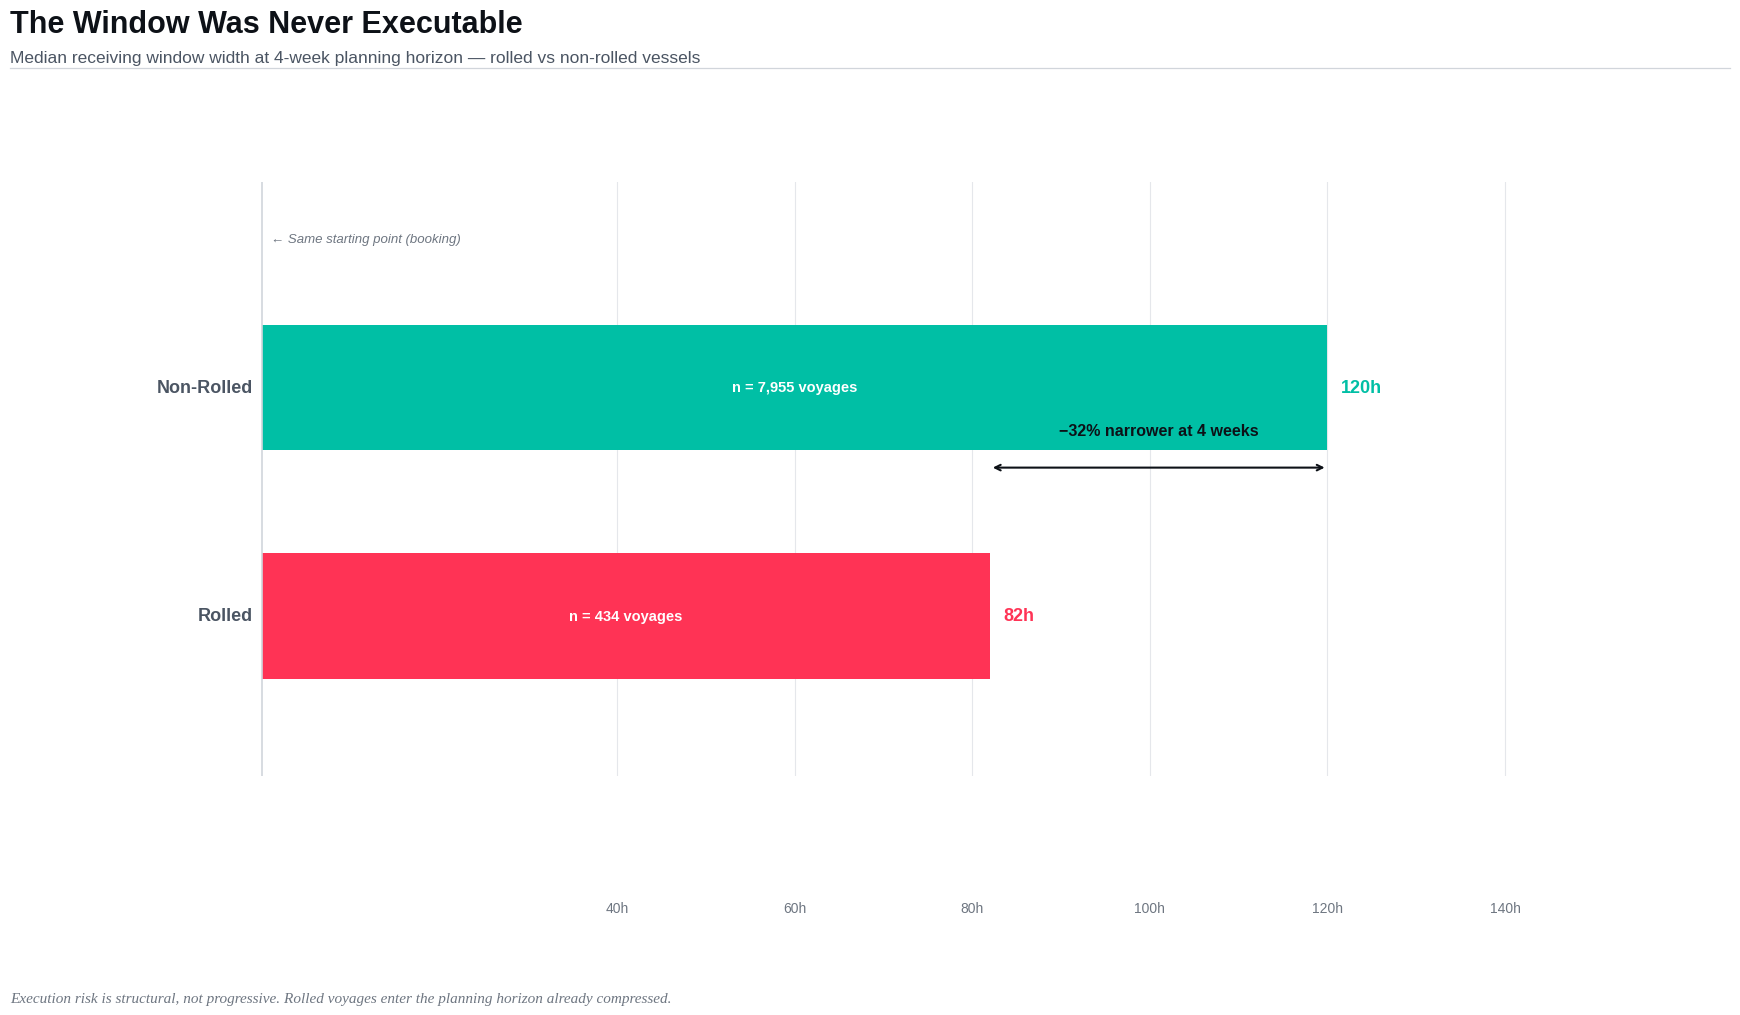
- Median initial CRW (rolled): 82 hours
- Median initial CRW (non-rolled): 120 hours
- 91.2% of rolled voyages begin under 120 hours
The initial receiving window is already below the threshold required for reliable execution.
The risk is structural.
Not progressive.
Figure 2 - Structural Window Split
Execution risk is embedded at first observation - not accumulated.
The Signal Arrives Between Checks
Manual monitoring assumes: Changes arrive at a pace humans can observe.
The data shows something else.
- Median gap between CRW changes: 7 hours
- 53.2% of gaps are under 12 hours
- In the final 72 hours, 48.6% of changes arrive within 12 hours of each other
A check at 08:00 and 20:00 samples the system twice.
The system can move three or four times in between.
This is not a visibility problem.
It is a sampling mismatch.
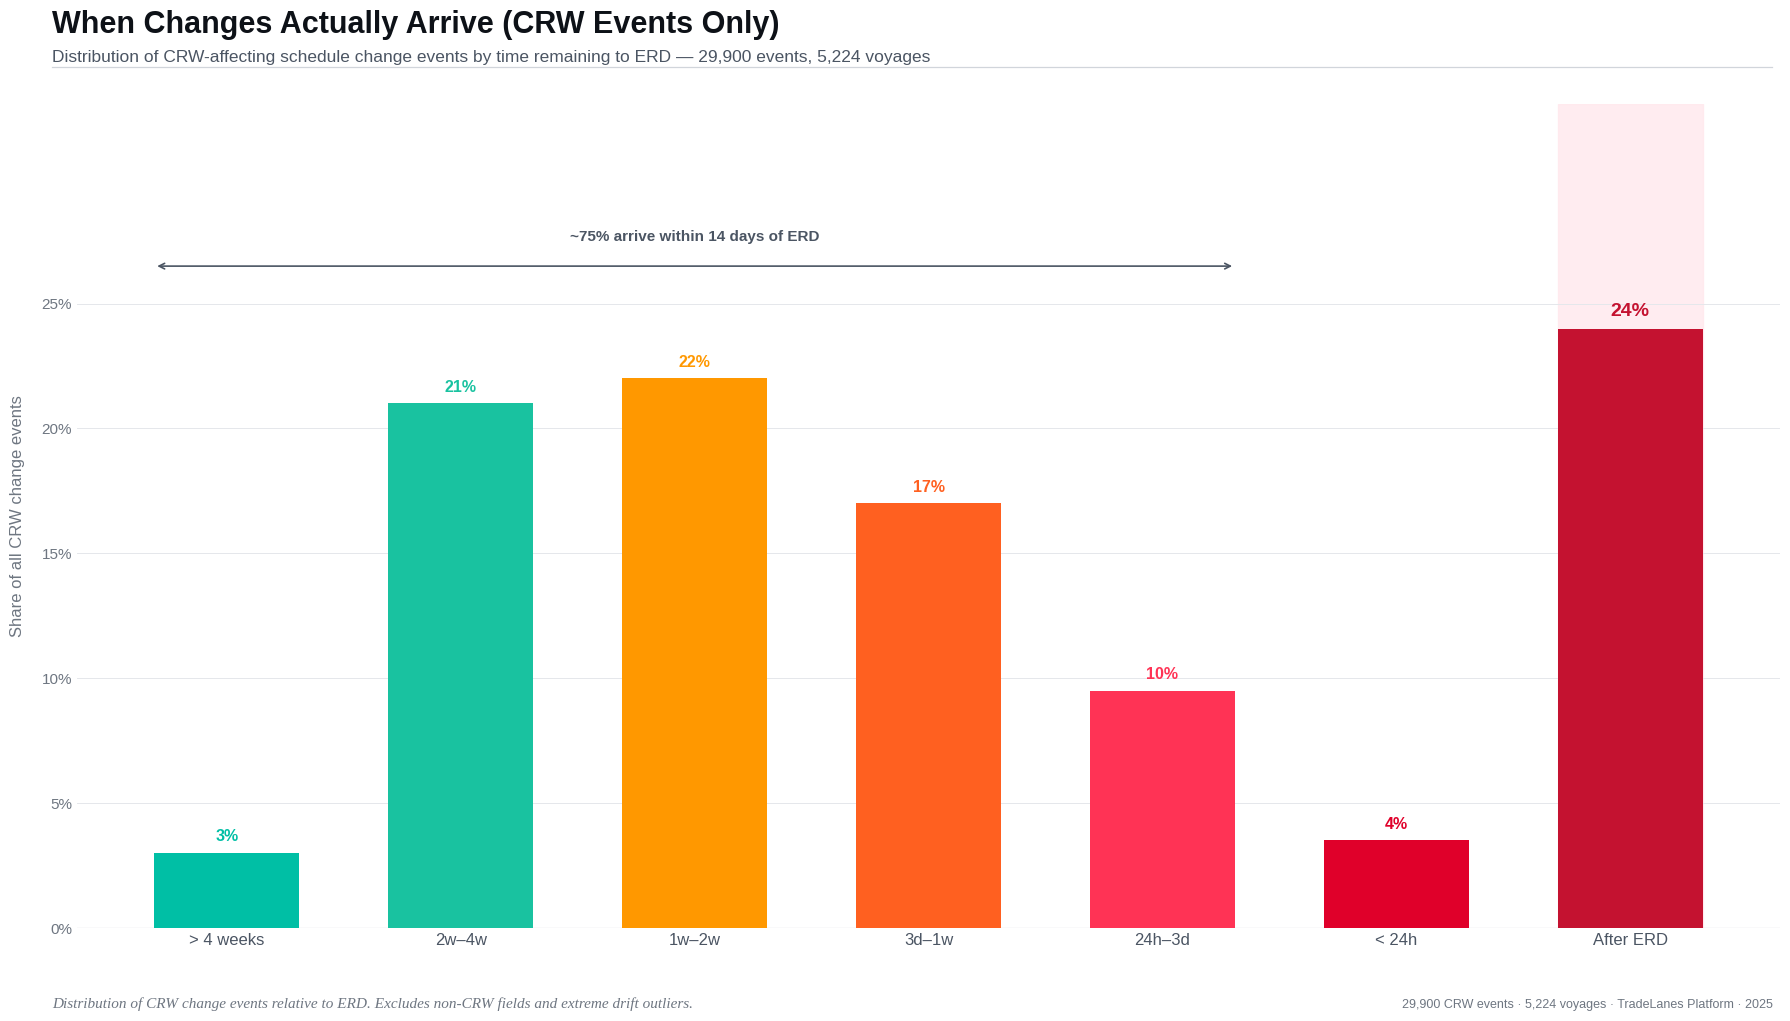
Figure 3 - Event Timing Distribution
Changes do not arrive evenly. They cluster.
The Constraint
Manual monitoring introduces a fixed delay:
Observe → Interpret → Act
That delay is not optional.
It is built into the process.
The Monitoring Model Fails Under Its Own Assumptions
Under a twice-daily cadence:
- Median detection lag: 8.5 hours
- Median time remaining at detection: 33 hours
- 40.1% of decision events are detected with <24 hours remaining
- 7.2% are detected after ERD
At that point:
The decision is no longer available. Detection is no longer actionable.
Monitoring has become observation.
Not control.
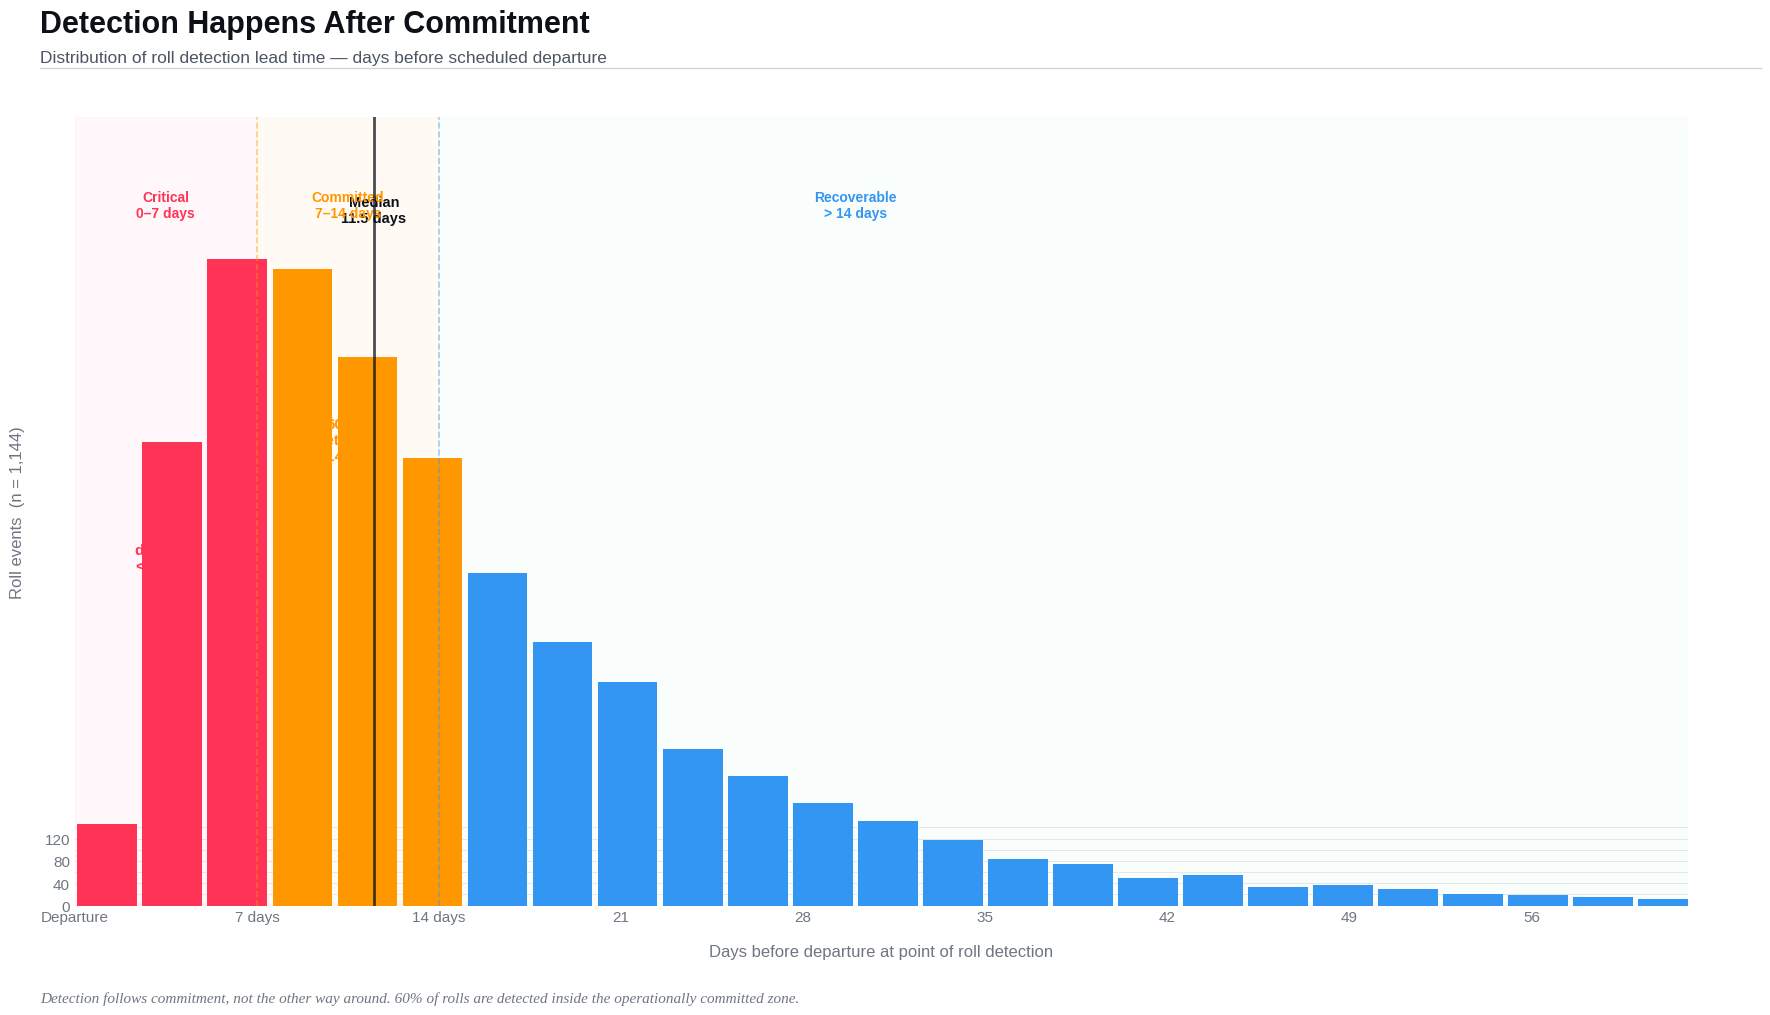
Figure 4 - Detection Lag vs Remaining Time
Detection does not precede commitment. It follows it.
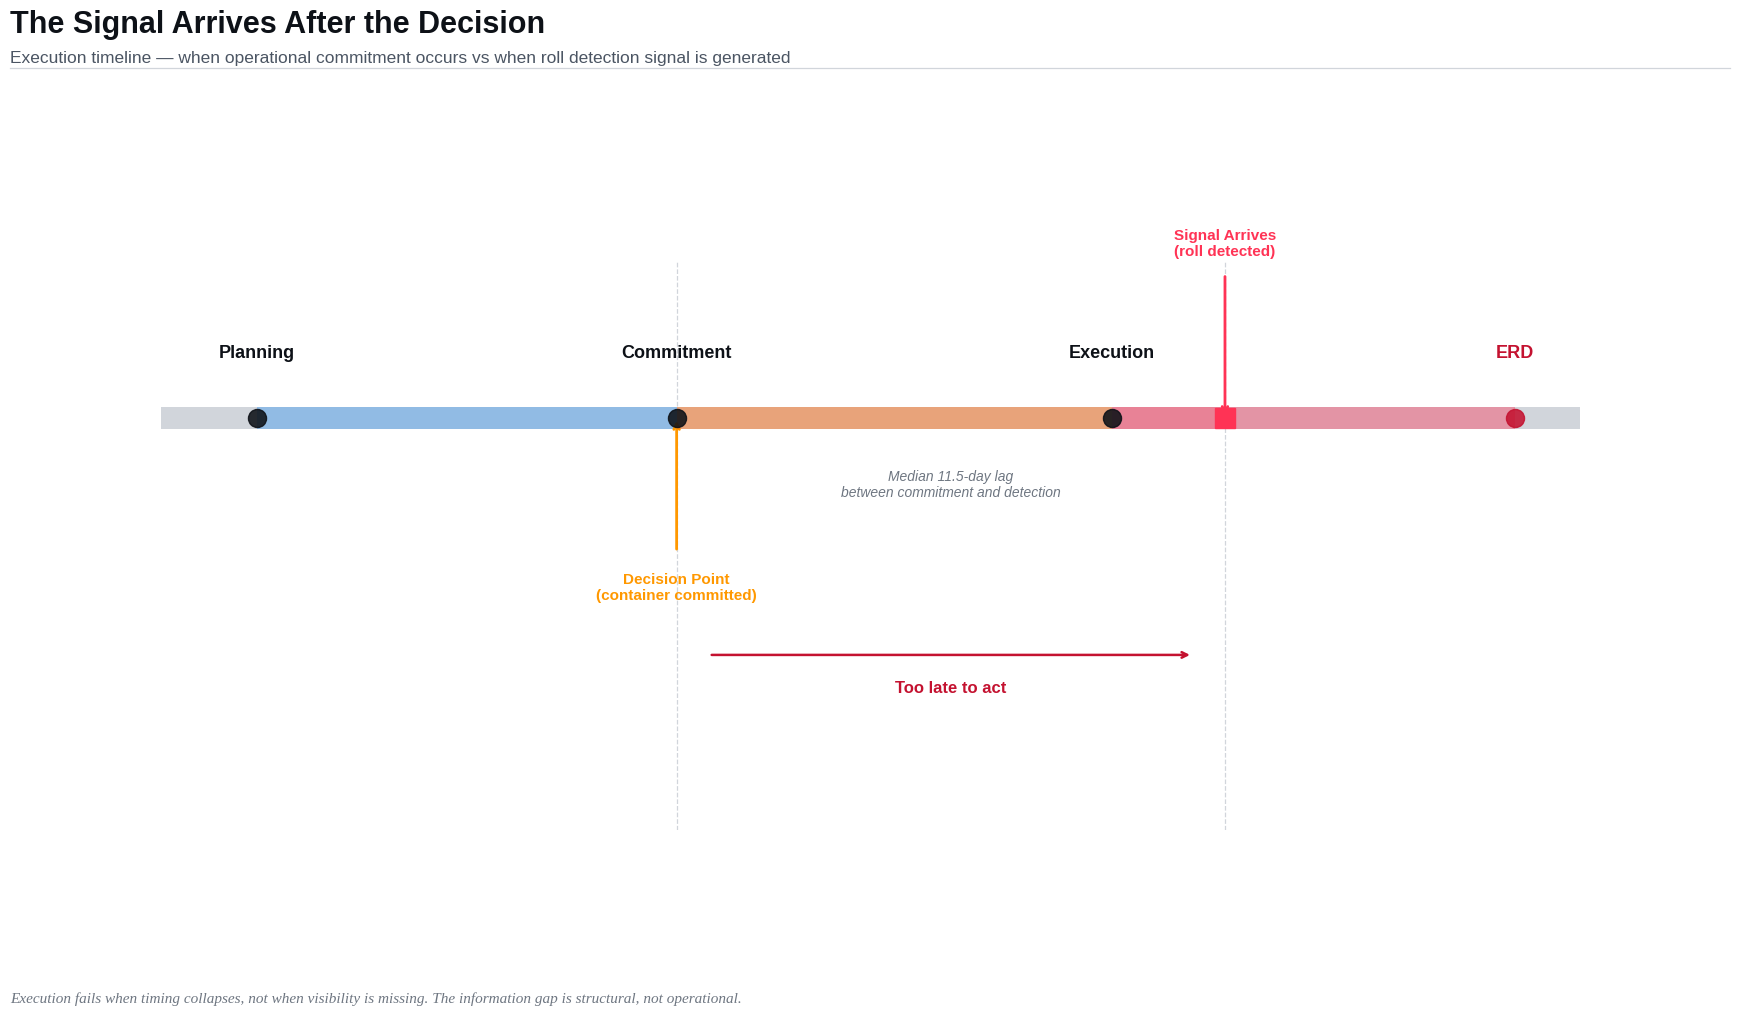
The Signal Arrives Inside the Commitment Zone
Most schedule intelligence arrives when it can no longer drive action.
Across all CRW changes:
- 75.1% arrive inside 14 days
- 15.7% arrive after ERD
On rolled vessels:
- 60% arrive inside 72 hours
- 52.6% arrive after ERD
These include updates that reflect terminal and carrier reconciliation after ERD - signals that confirm execution failure rather than prevent it.
This is not delayed visibility.
This is system behavior.
Figure 5 - Timing Waterfall
The system produces confirmation. Not early warning.
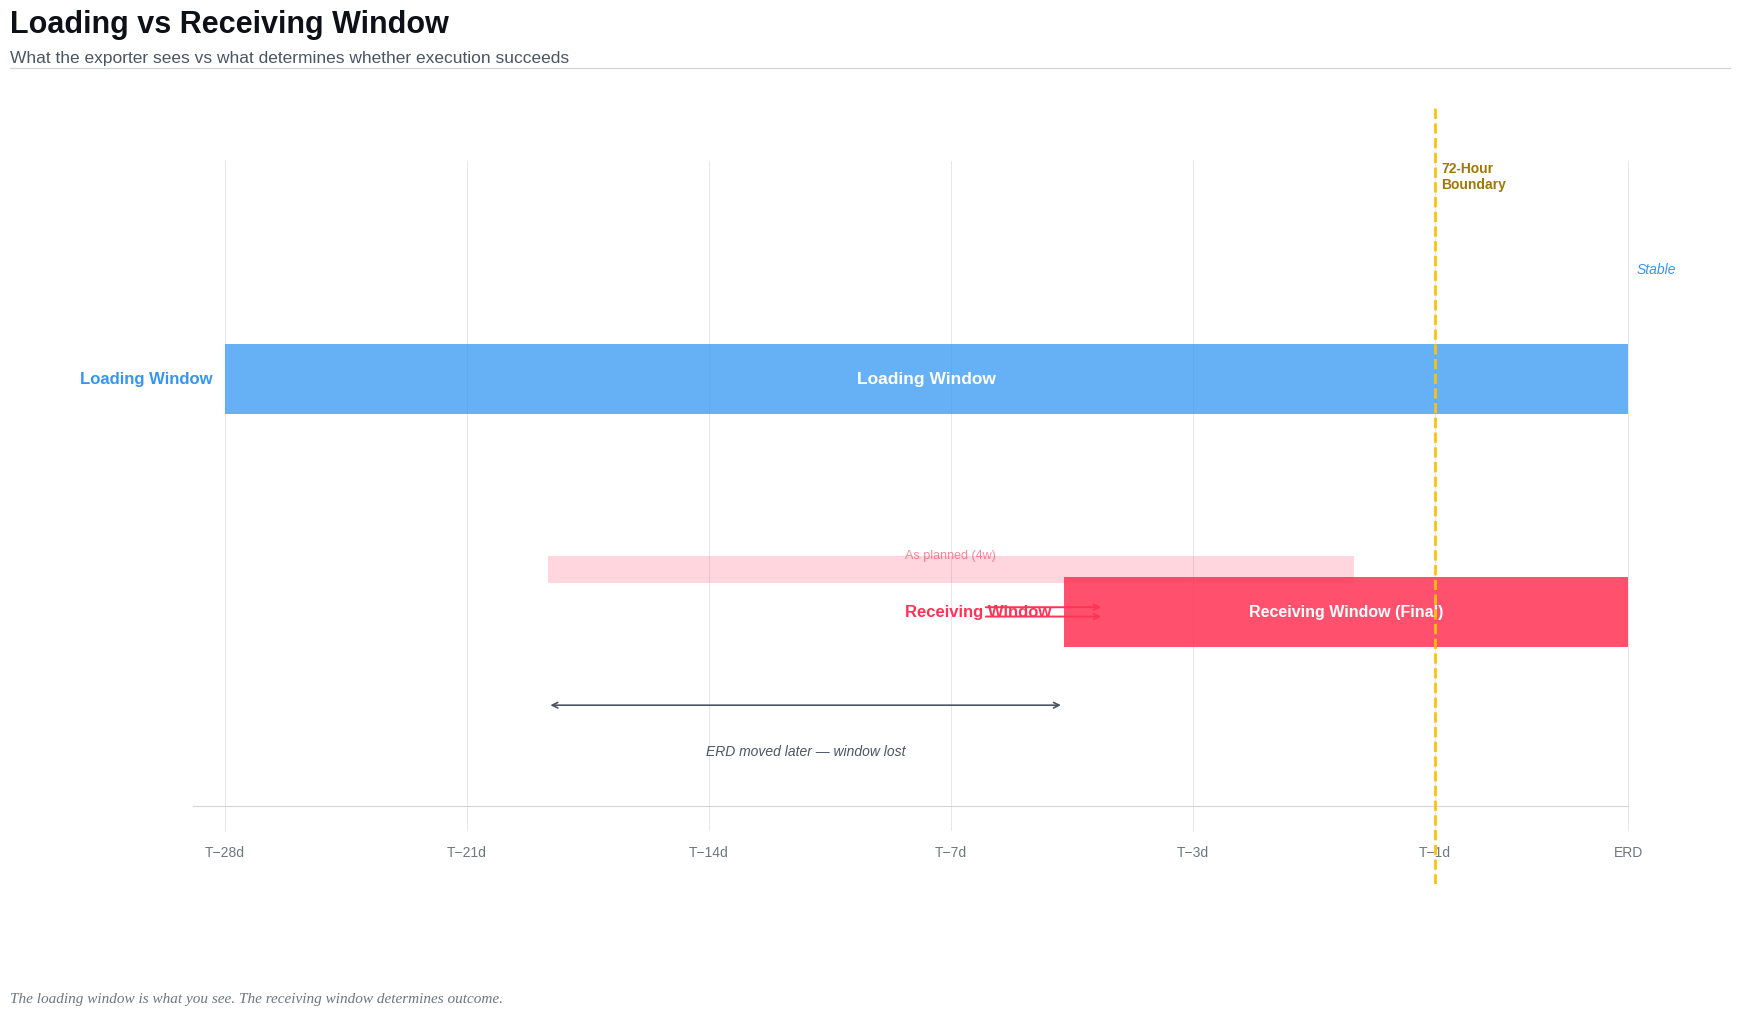
The Loading Window vs The Receiving Window
Export teams operate using the loading window.
Execution is governed by the receiving window.
The loading window is what you see:
- Vessel schedule
- Planned ETD
- Booking confirmation
The receiving window is what determines execution:
- ERD → CY Cut
- Terminal acceptance
- Actual gate-in feasibility
The two are not synchronized.
And they are not observed through the same system.
Figure 6 - Loading vs Receiving Window
Expectation is stable. Execution is not.
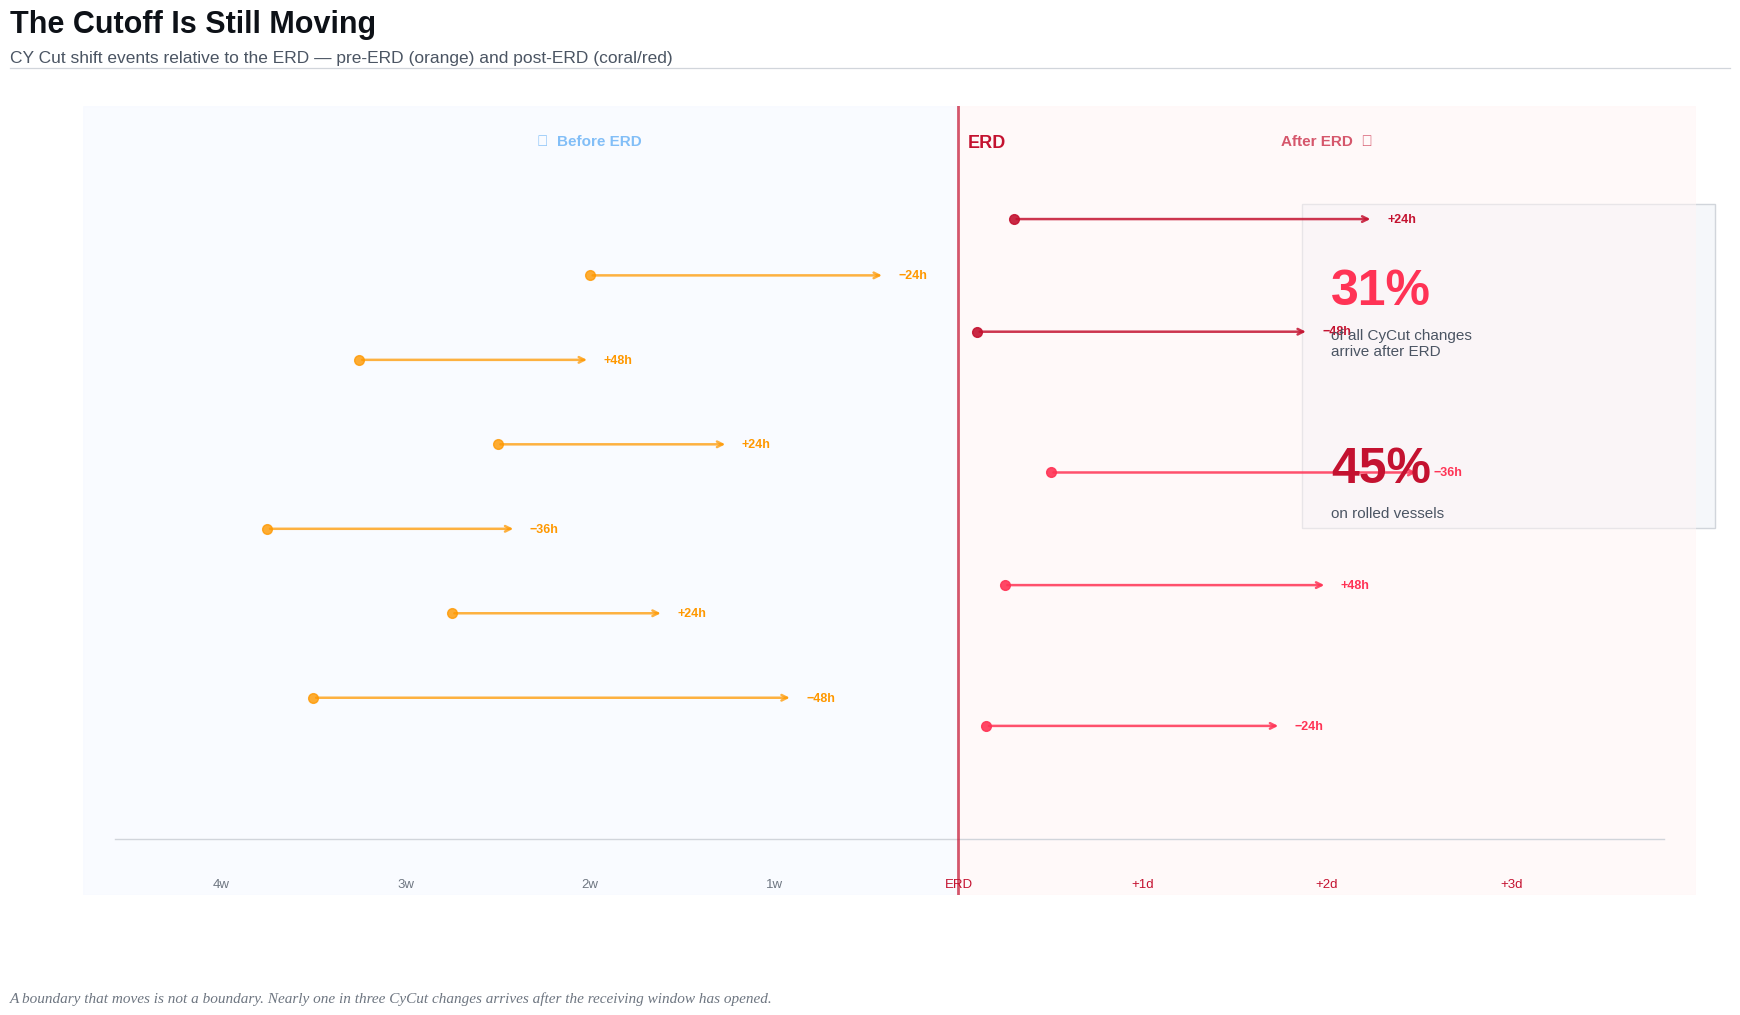
The Cutoff Is Not a Boundary
The CY Cut is treated as fixed.
It isn’t.
- 31.2% of CY Cut changes occur after ERD
- 45% on rolled vessels
A boundary that moves is not a boundary.
Figure 7 - CY Cut Drift
The constraint moves after execution begins.
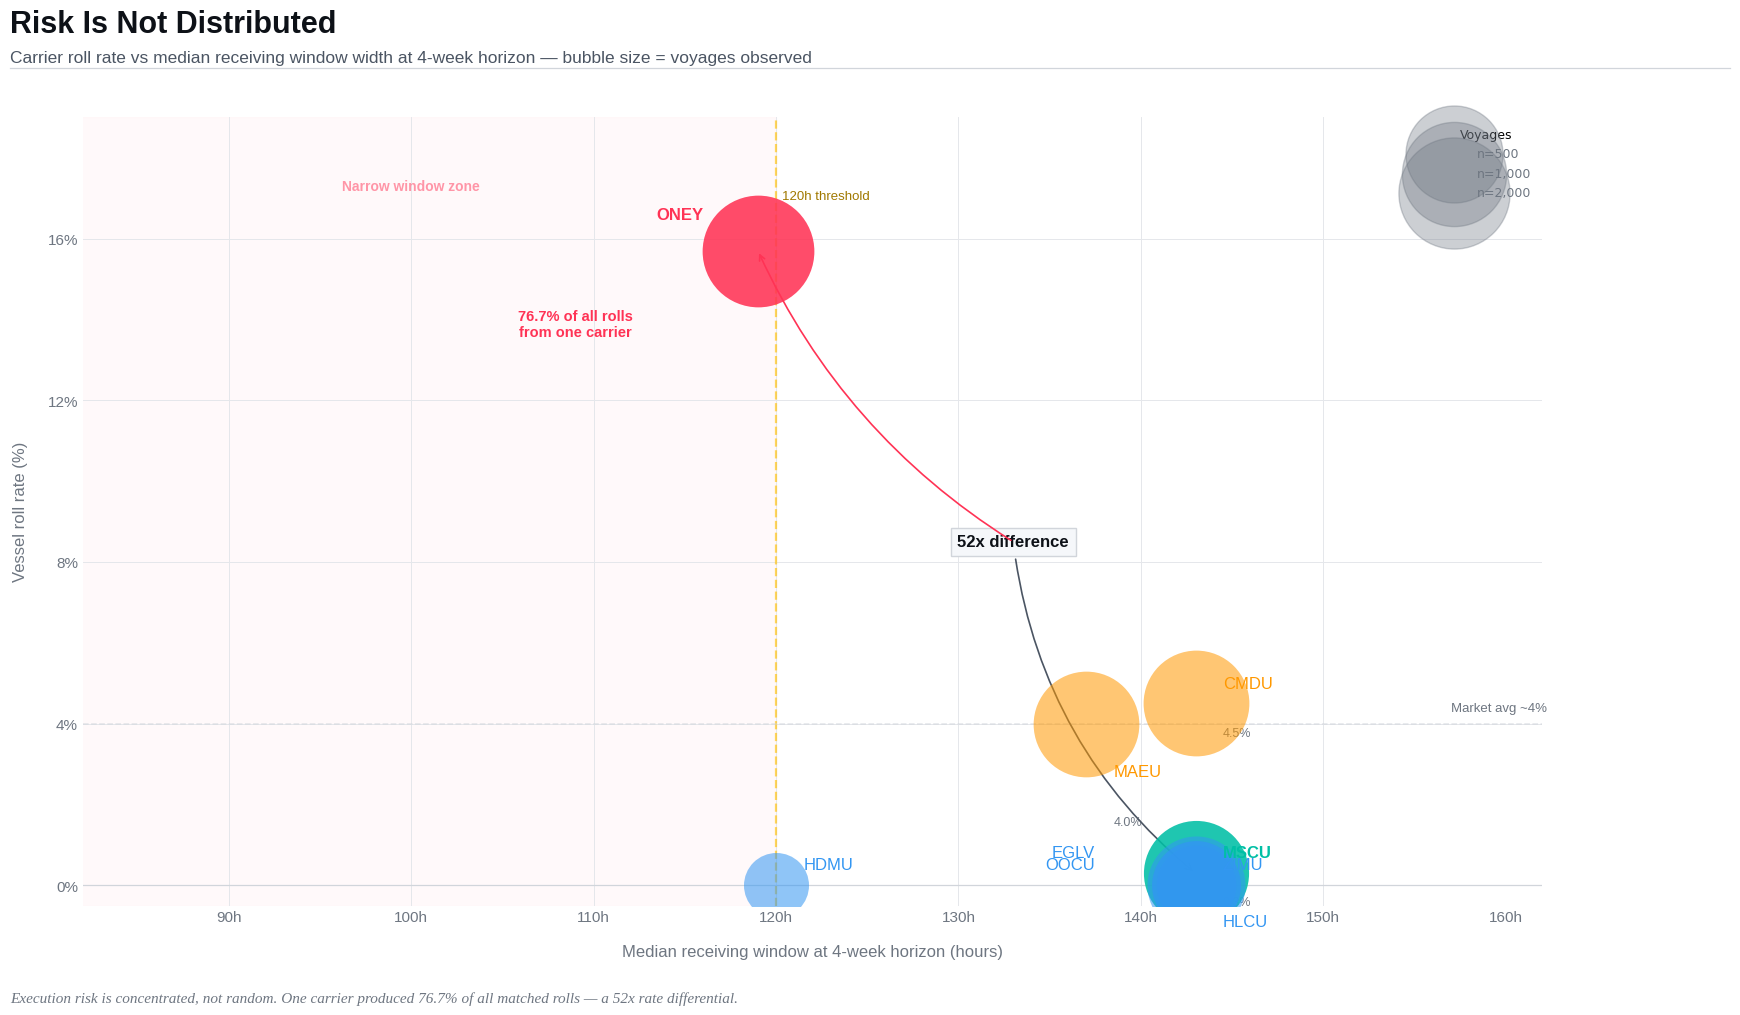
Risk Is Not Distributed
Risk is concentrated.
- ONEY: 15.7% roll rate
- MSCU: 0.3%
52× difference.
This is not randomness.
It is system structure.
This is structural interaction between:
- Carrier behavior
- Terminal conditions
- Timing patterns
Figure 8 - Carrier Risk Spread
Risk is not market-wide. It is localized.
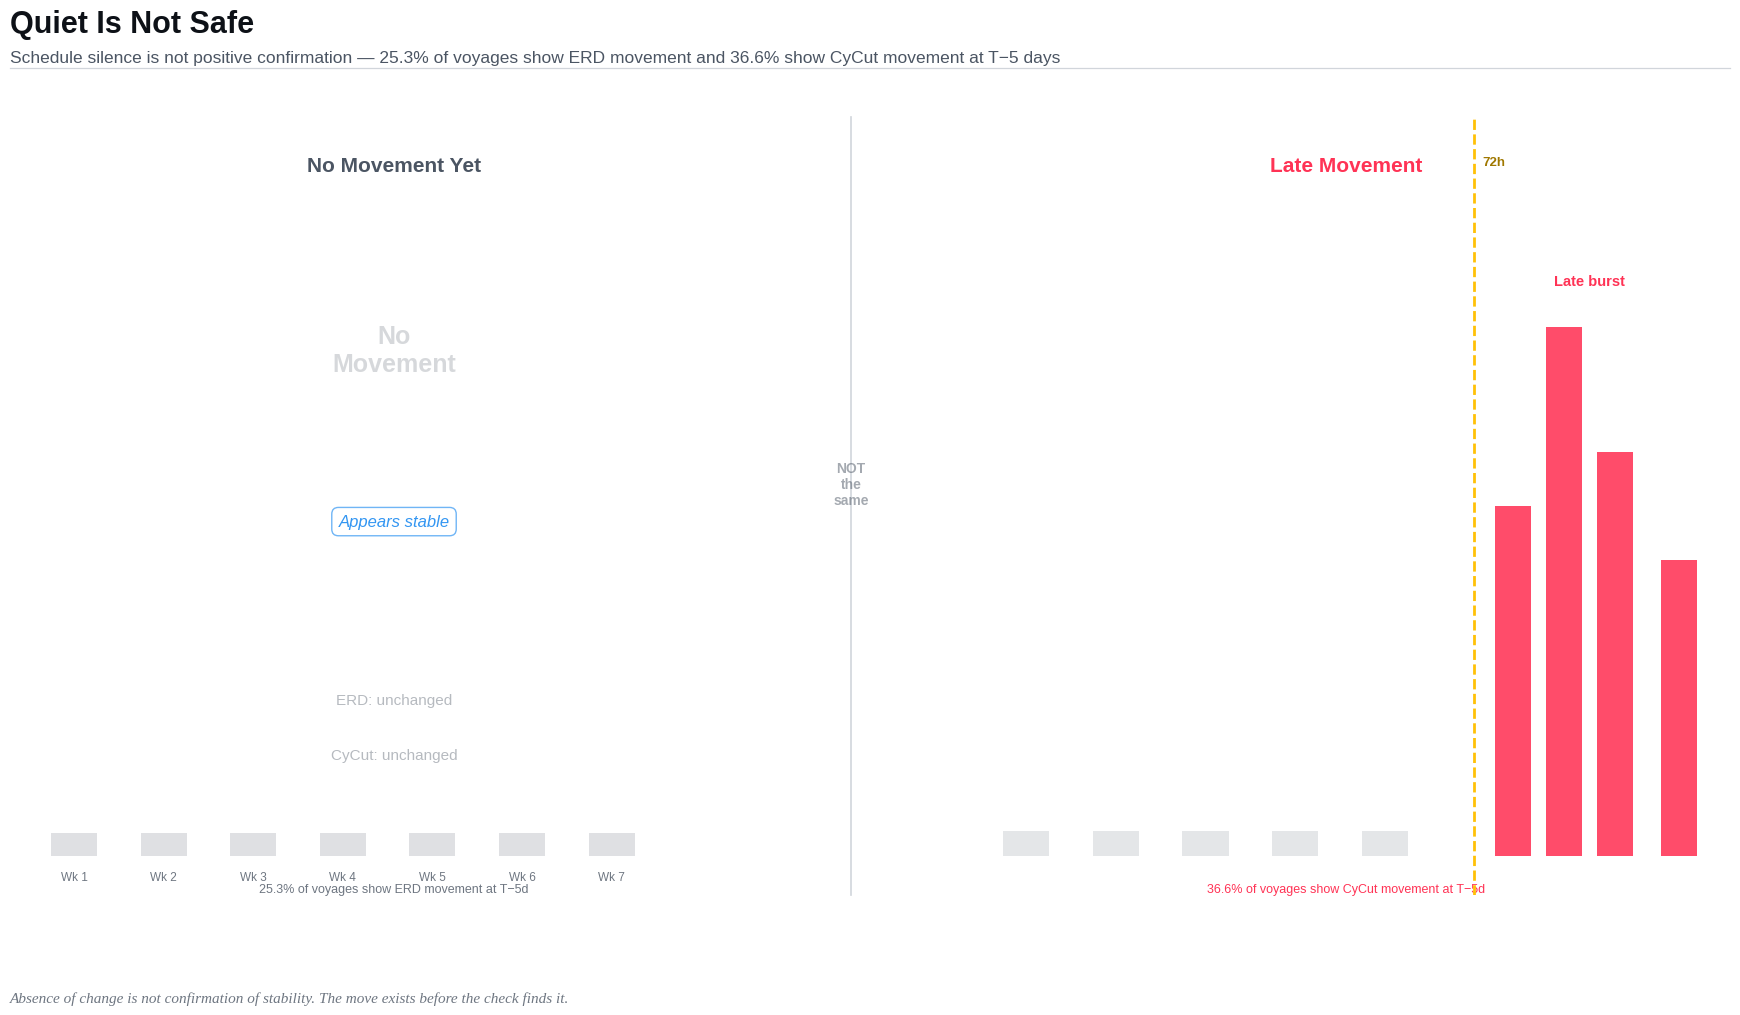
The Quiet Schedule Problem
At 5 days before ERD:
- 25.3% show ERD movement
- 36.6% show CY Cut movement
The rest appear stable.
They are not confirmed stable.
They have not moved yet.
Absence of change is not confirmation of stability.
Figure 9 - Quiet vs Moving Schedules
Silence is not stability. It is latency.
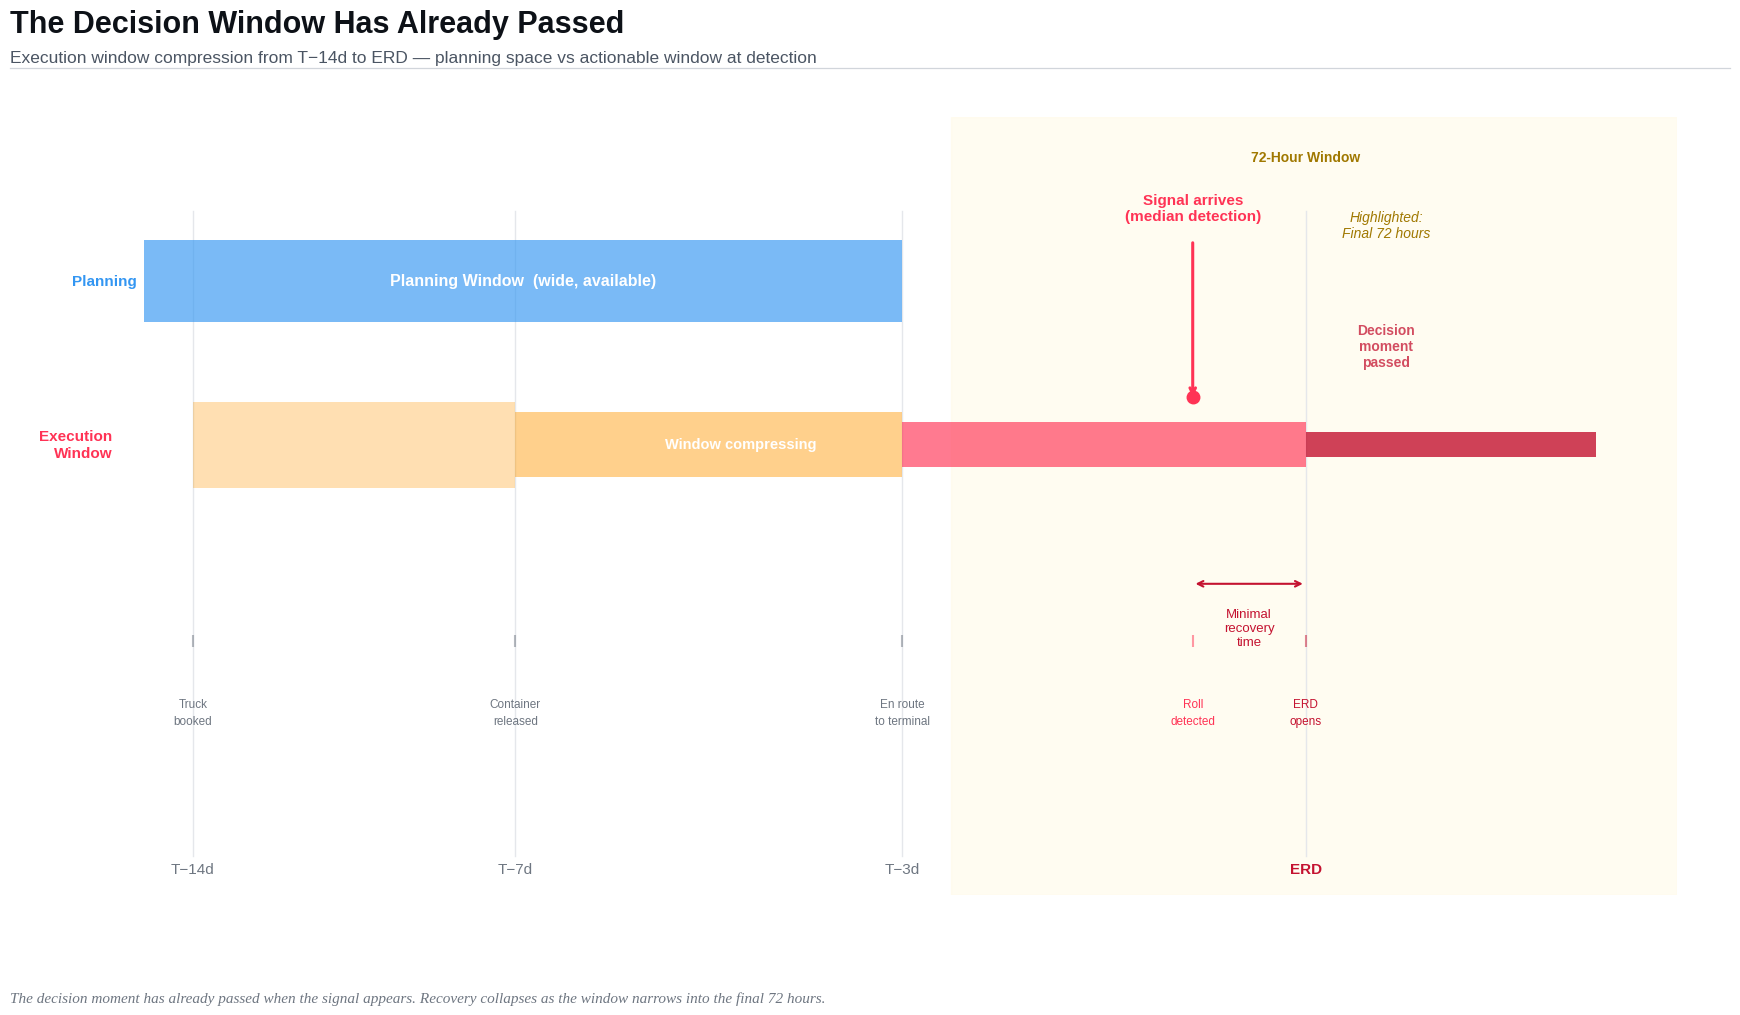
Execution Decay
Execution does not fail gradually.
It fails when timing compresses.
It fails when:
- The window is already narrow
- Changes arrive in bursts
- Detection lags behind clustering
- The signal appears after commitment
This is execution decay.
Not as a process.
As a structure.
Figure 10 - Execution Timeline
The signal arrives after the decision moment has passed.
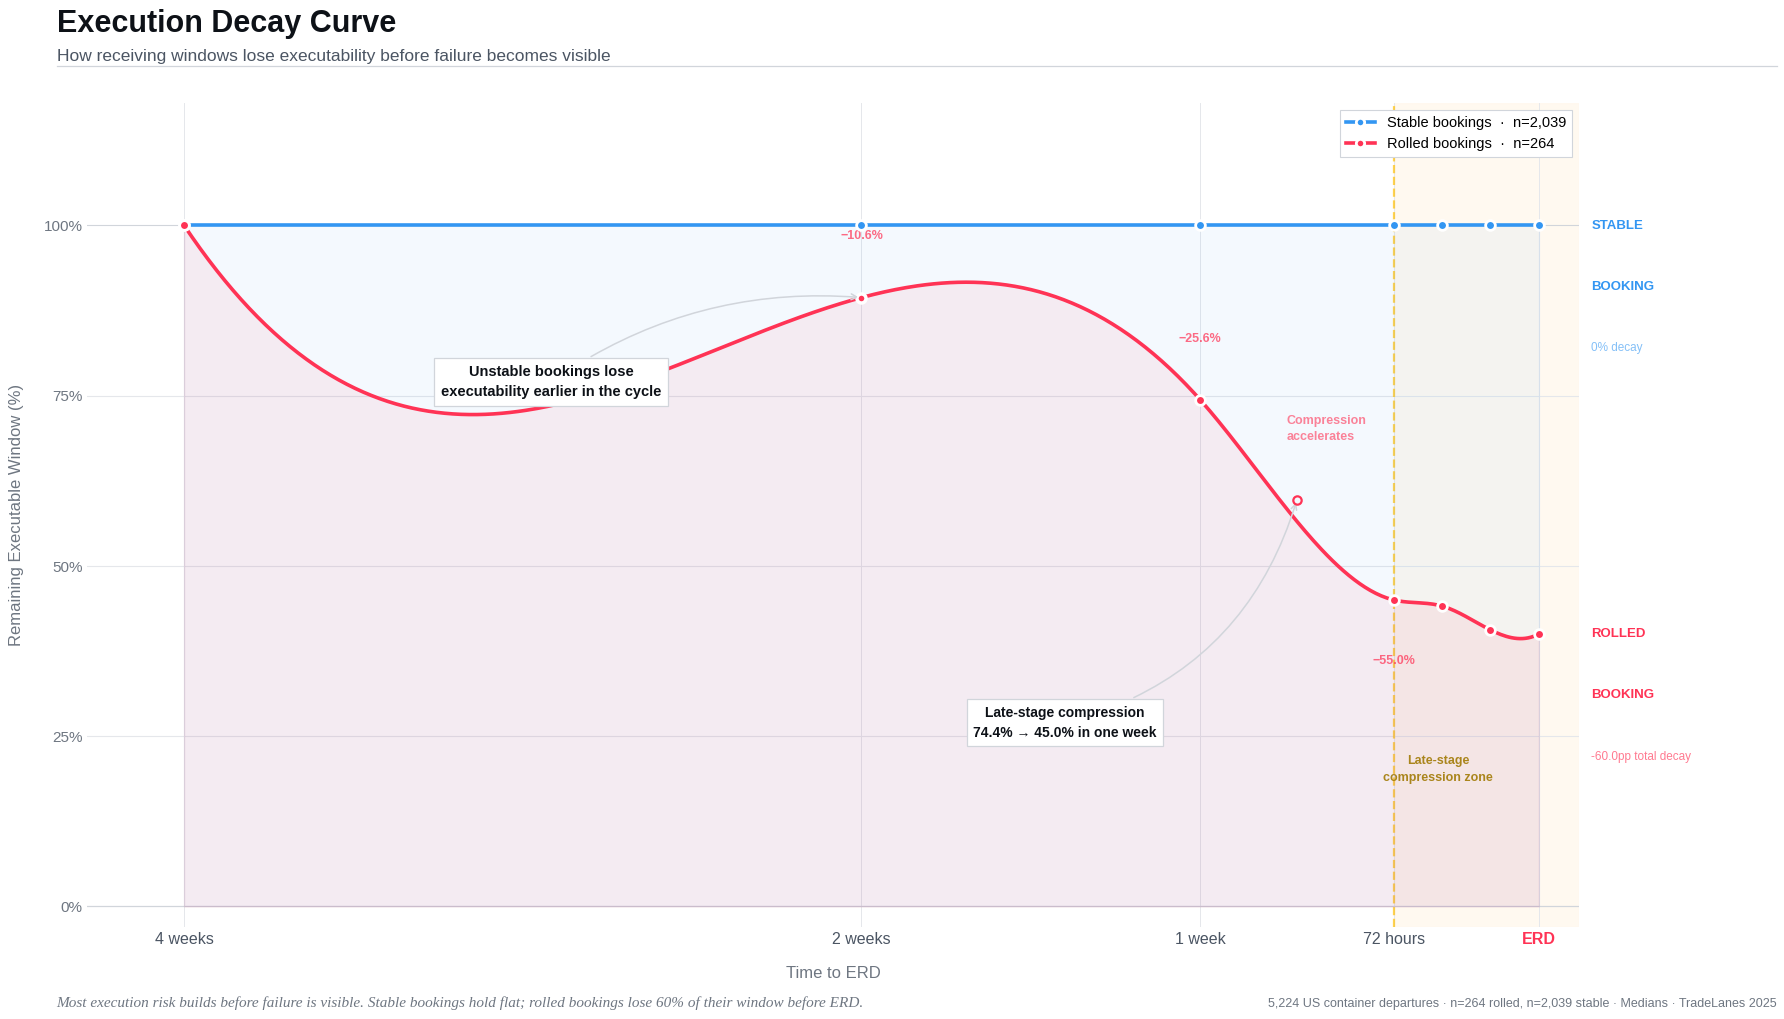
The Shape of Failure
Execution does not fail suddenly.
It decays.
At first, the window appears stable. Changes are small. Adjustments are manageable.
Then the system enters a different regime.
The rate of change increases. The window narrows faster. Recovery options collapse.
By the time failure is visible, most of the decision space is already gone.
Figure 11 - Execution Decay Curve
Remaining executability declines gradually, then collapses as the system enters the final 72-hour window. Failure appears sudden. The decay that causes it is not.
The System Is Not Broken
The exporter does not act too late because they failed to monitor.
They act too late because:
The system produces risk faster than a fixed cadence can observe it.
Checking twice a day is not risk management.
It is a schedule.
And it is not the schedule the risk follows.
You cannot manage a non-uniform arrival process with a uniform checking cadence.


Leave a Comment